
A chart that knows your trades
On 20 October, TradingView launched AI Copilot, an assistant that works directly on your charts, as a paid monthly add-on. The same autumn, it also shipped an official agent skill with Lightweight Charts, its free and open-source chart library. That made me wonder whether I could stop paying for charting platforms and instead build a platform of my own, one that knows my trades, runs on my own computer and that I can customise exactly to my preferences.
What I built
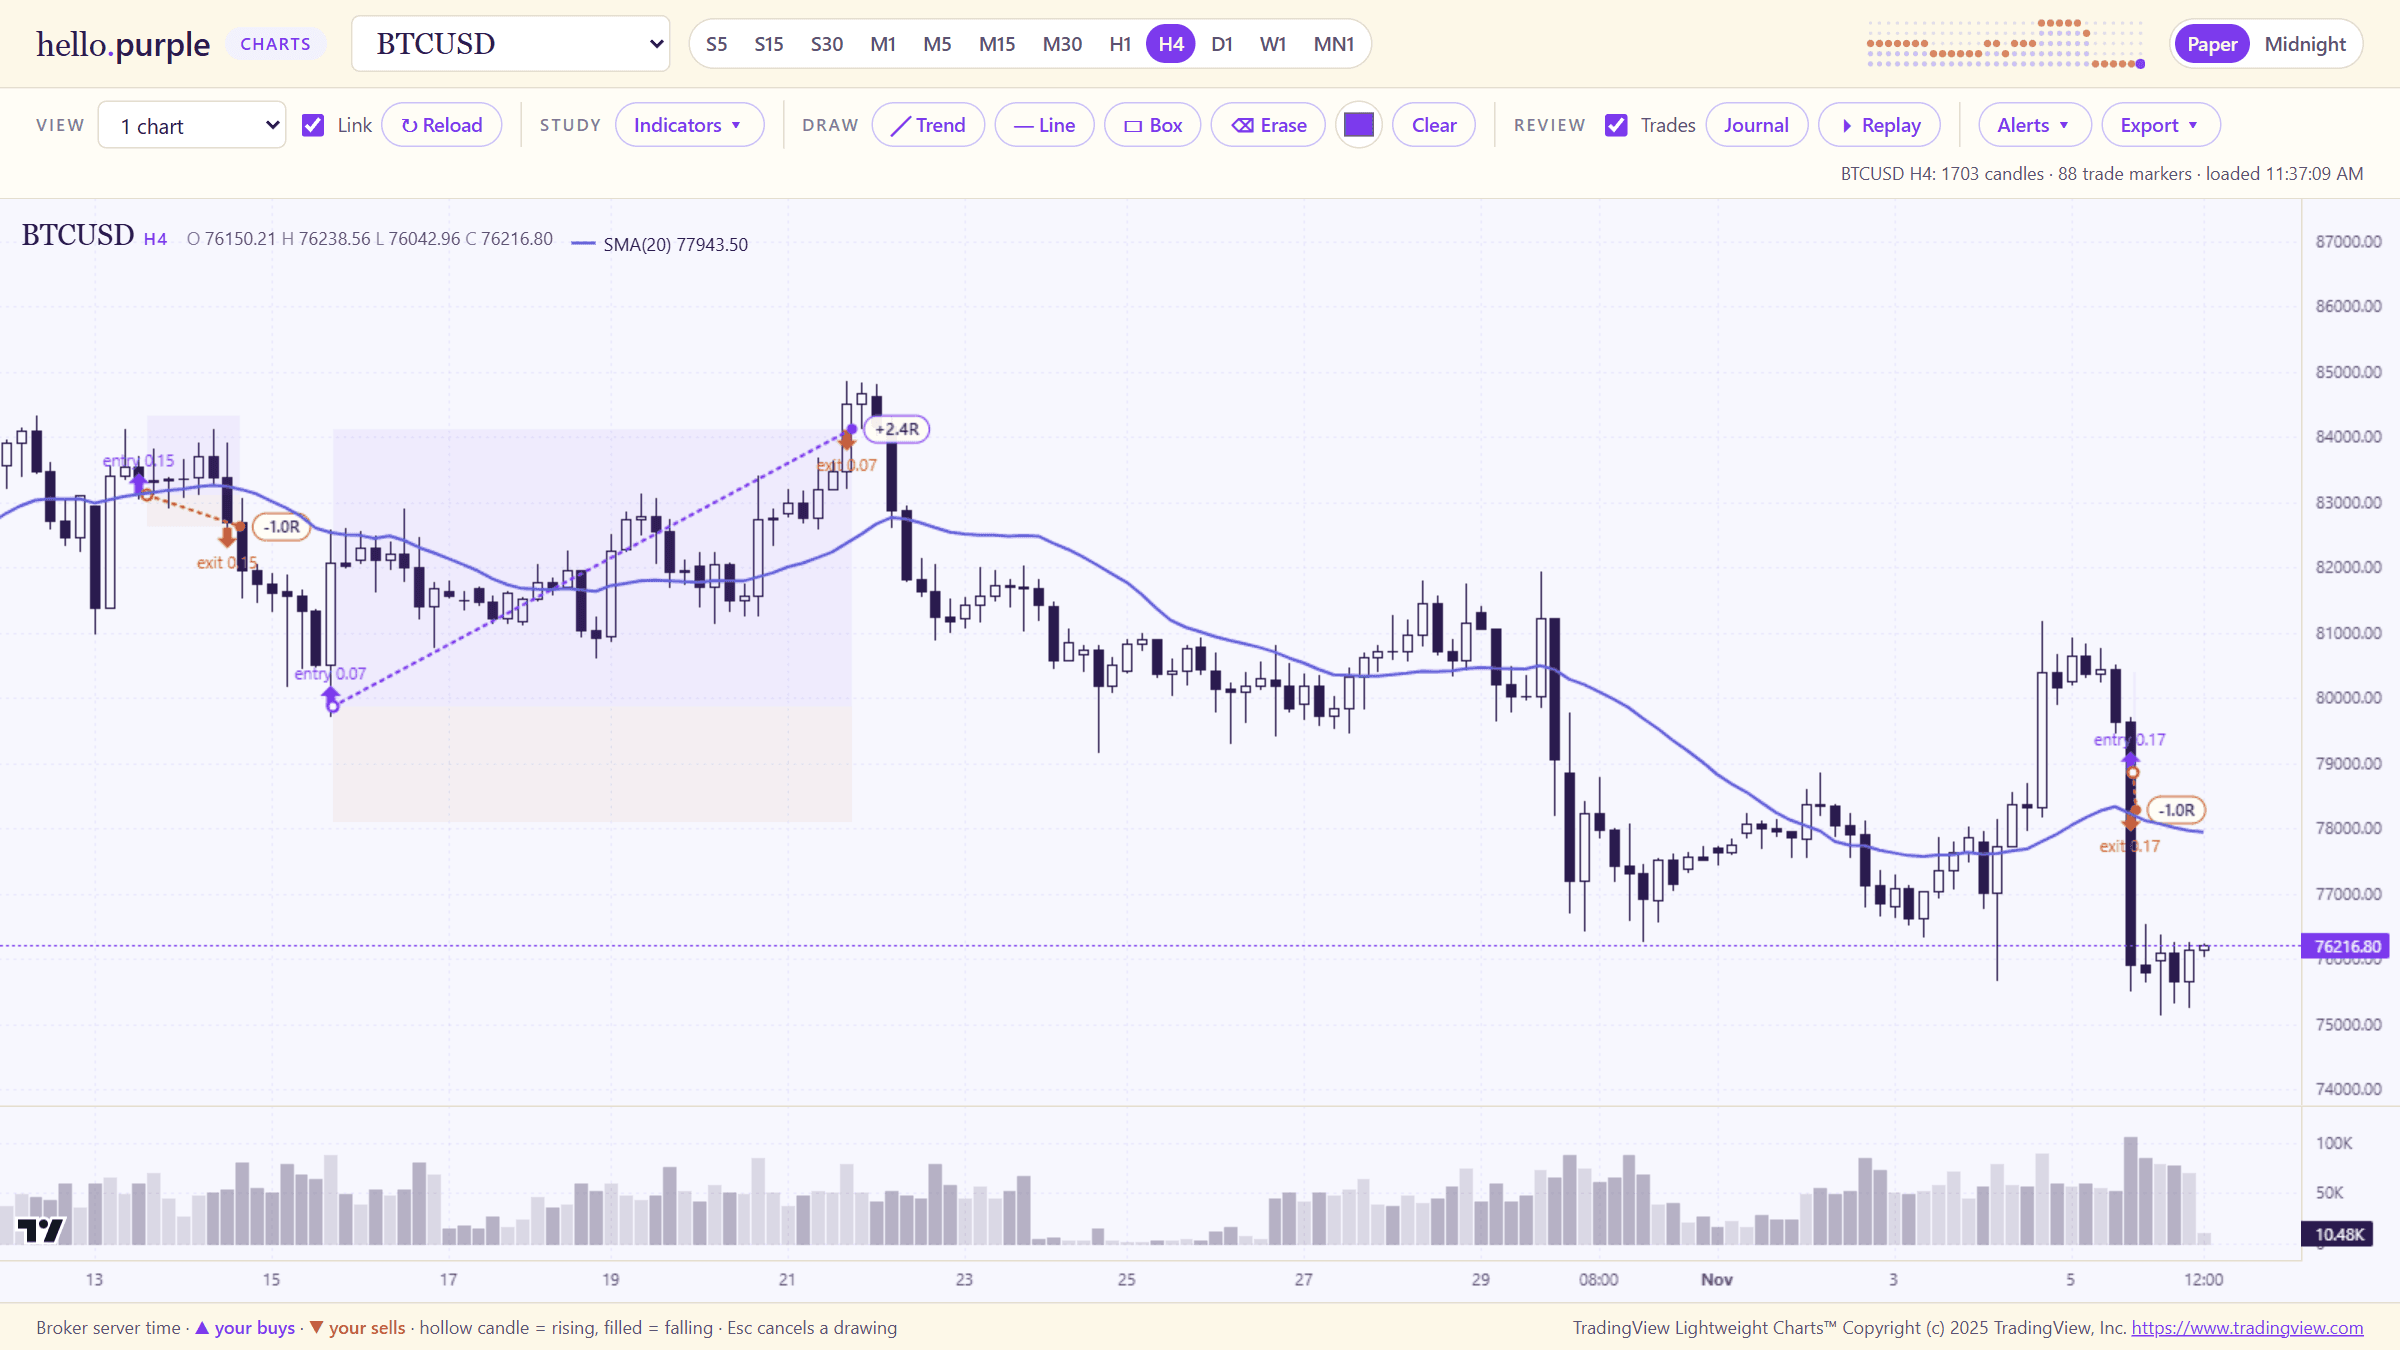
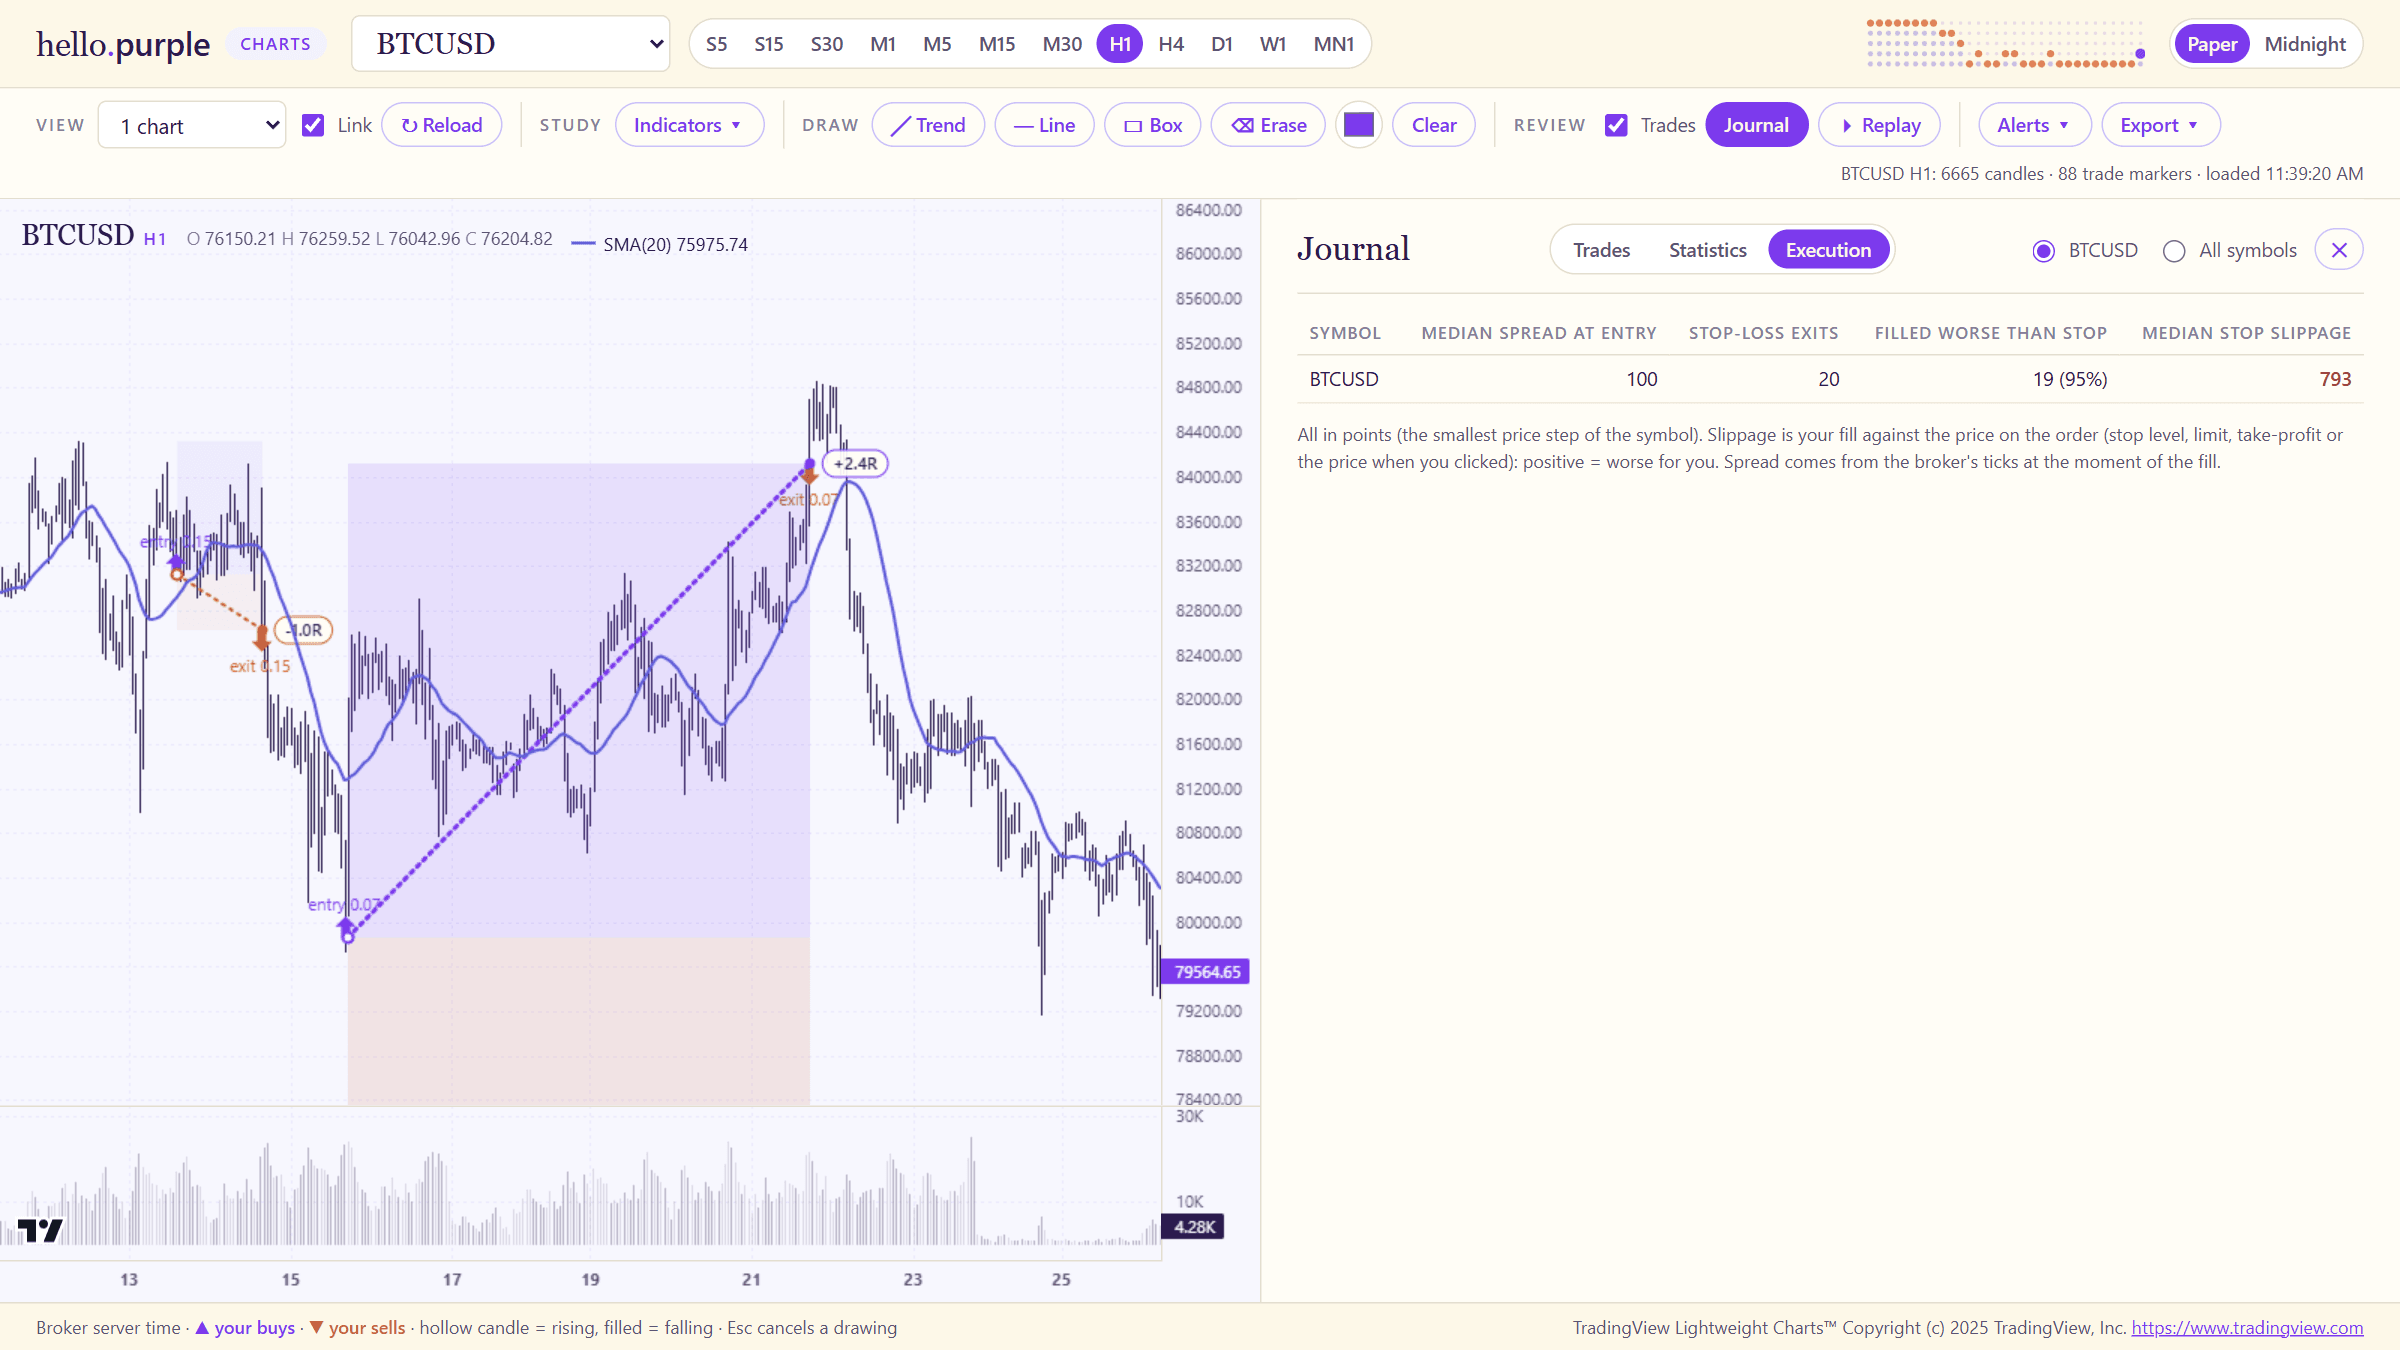
Most of what you see on the screen is a copy of what you already know from TradingView or any other advanced trading platform. There are candlestick charts on every timeframe from five seconds up to a month, every symbol my broker offers, moving averages, Bollinger Bands, RSI and MACD, drawing tools, up to four linked charts, alerts and a data export to CSV.
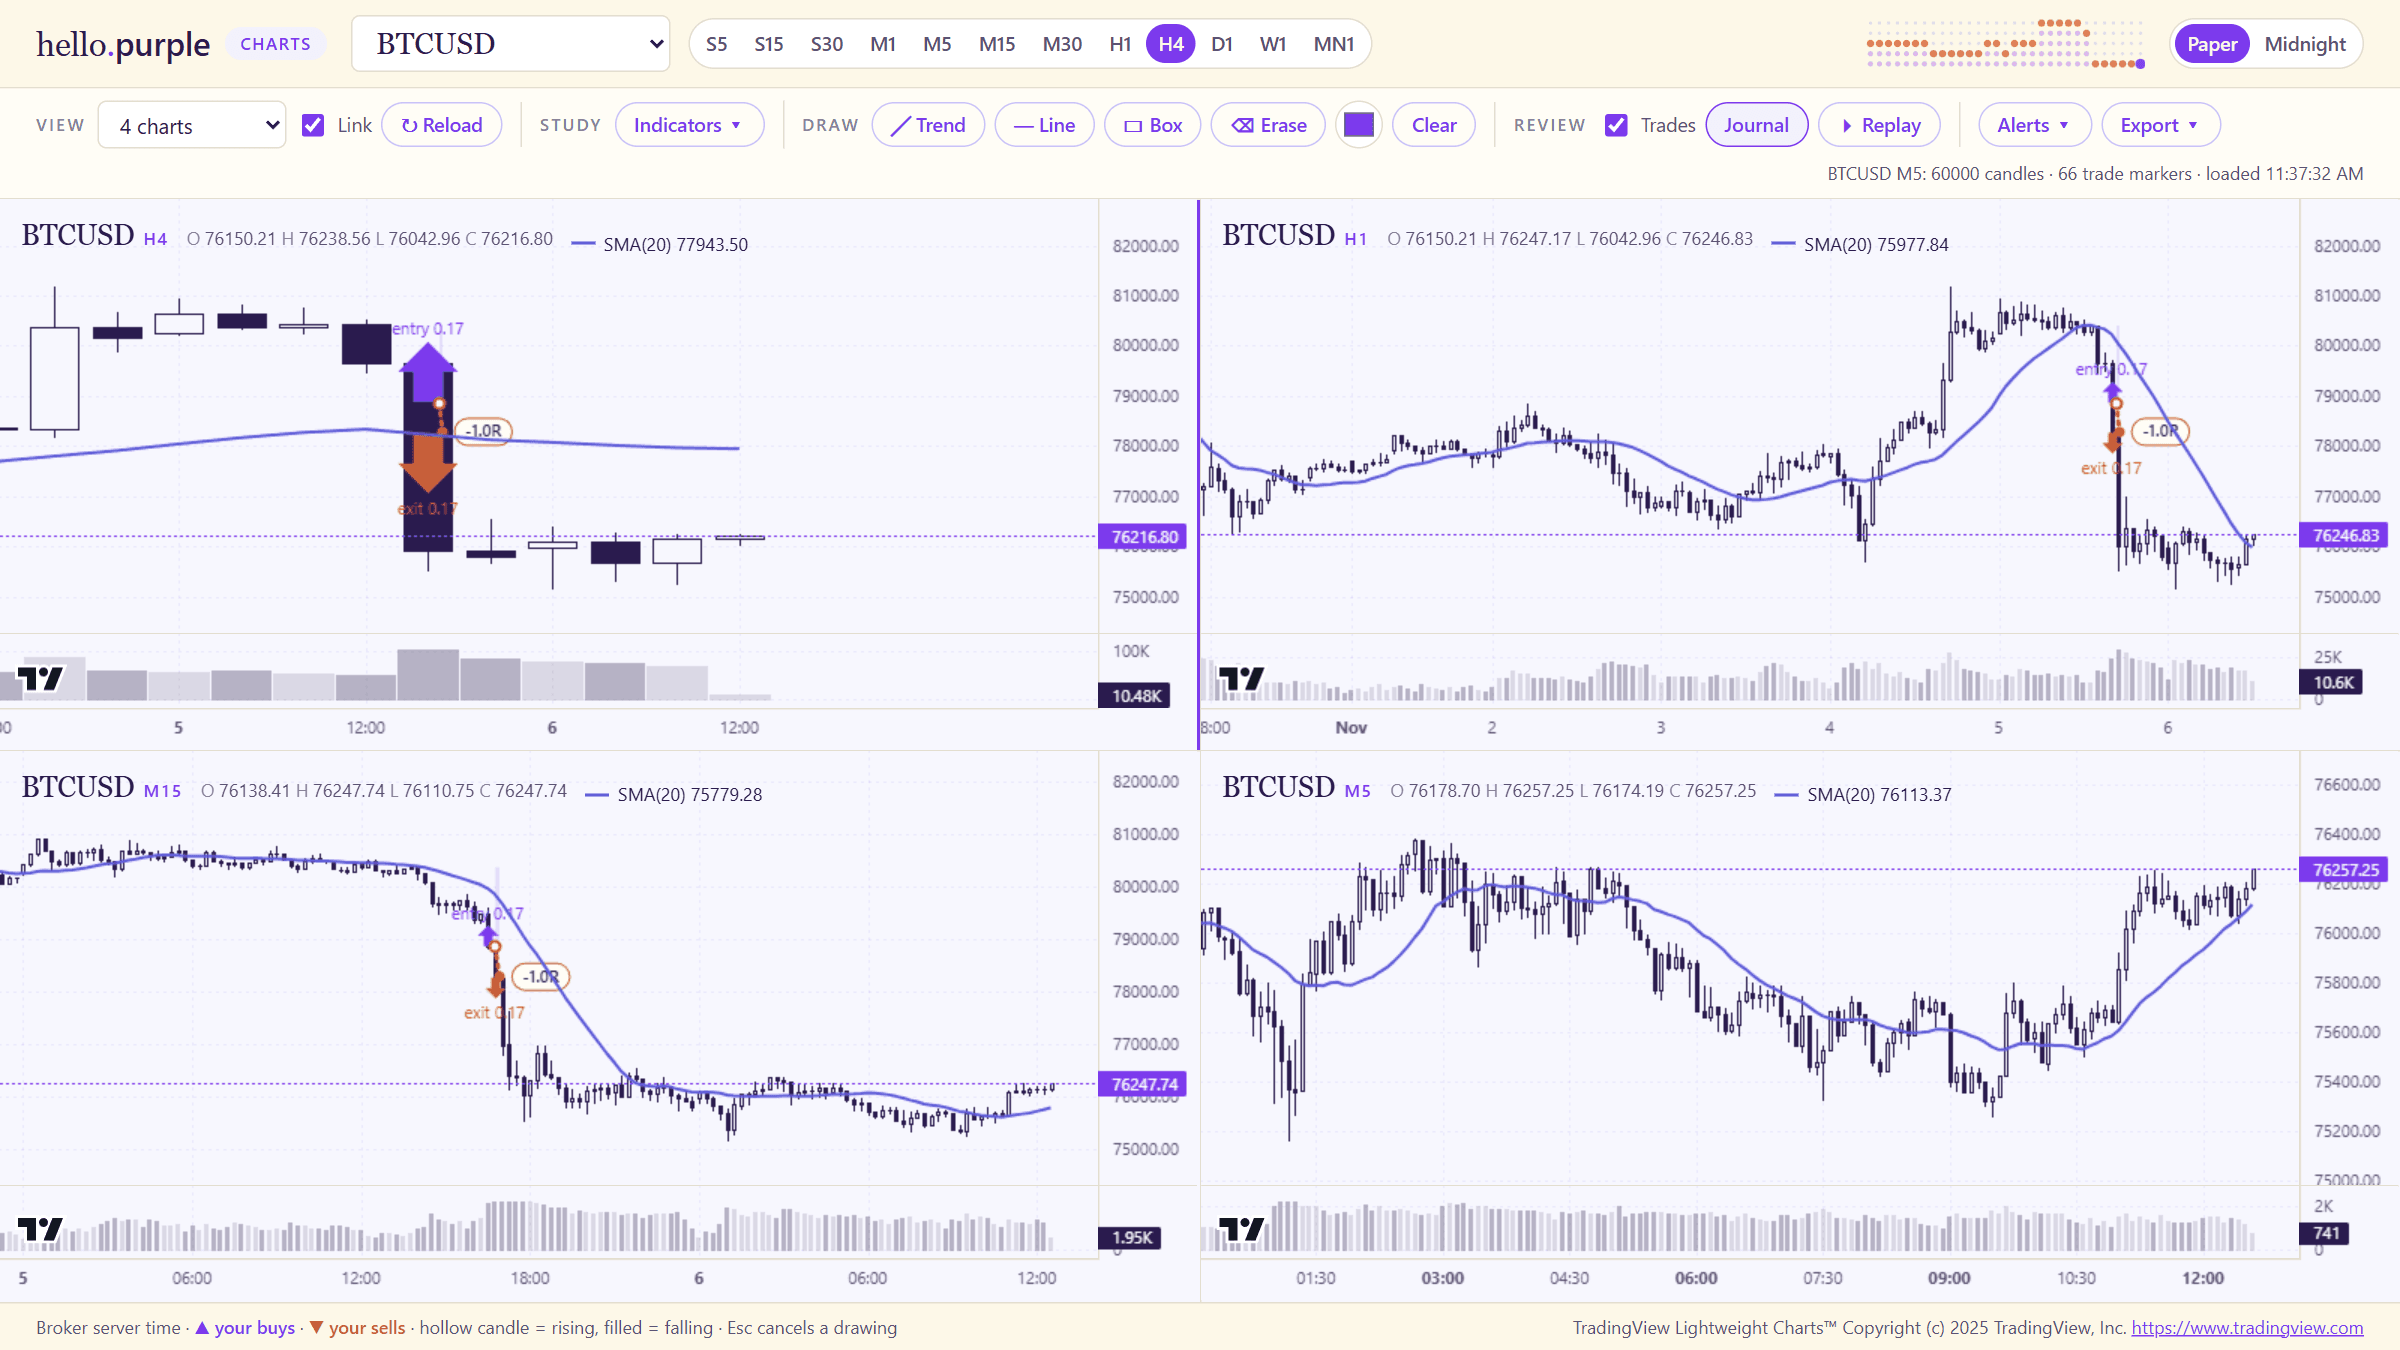
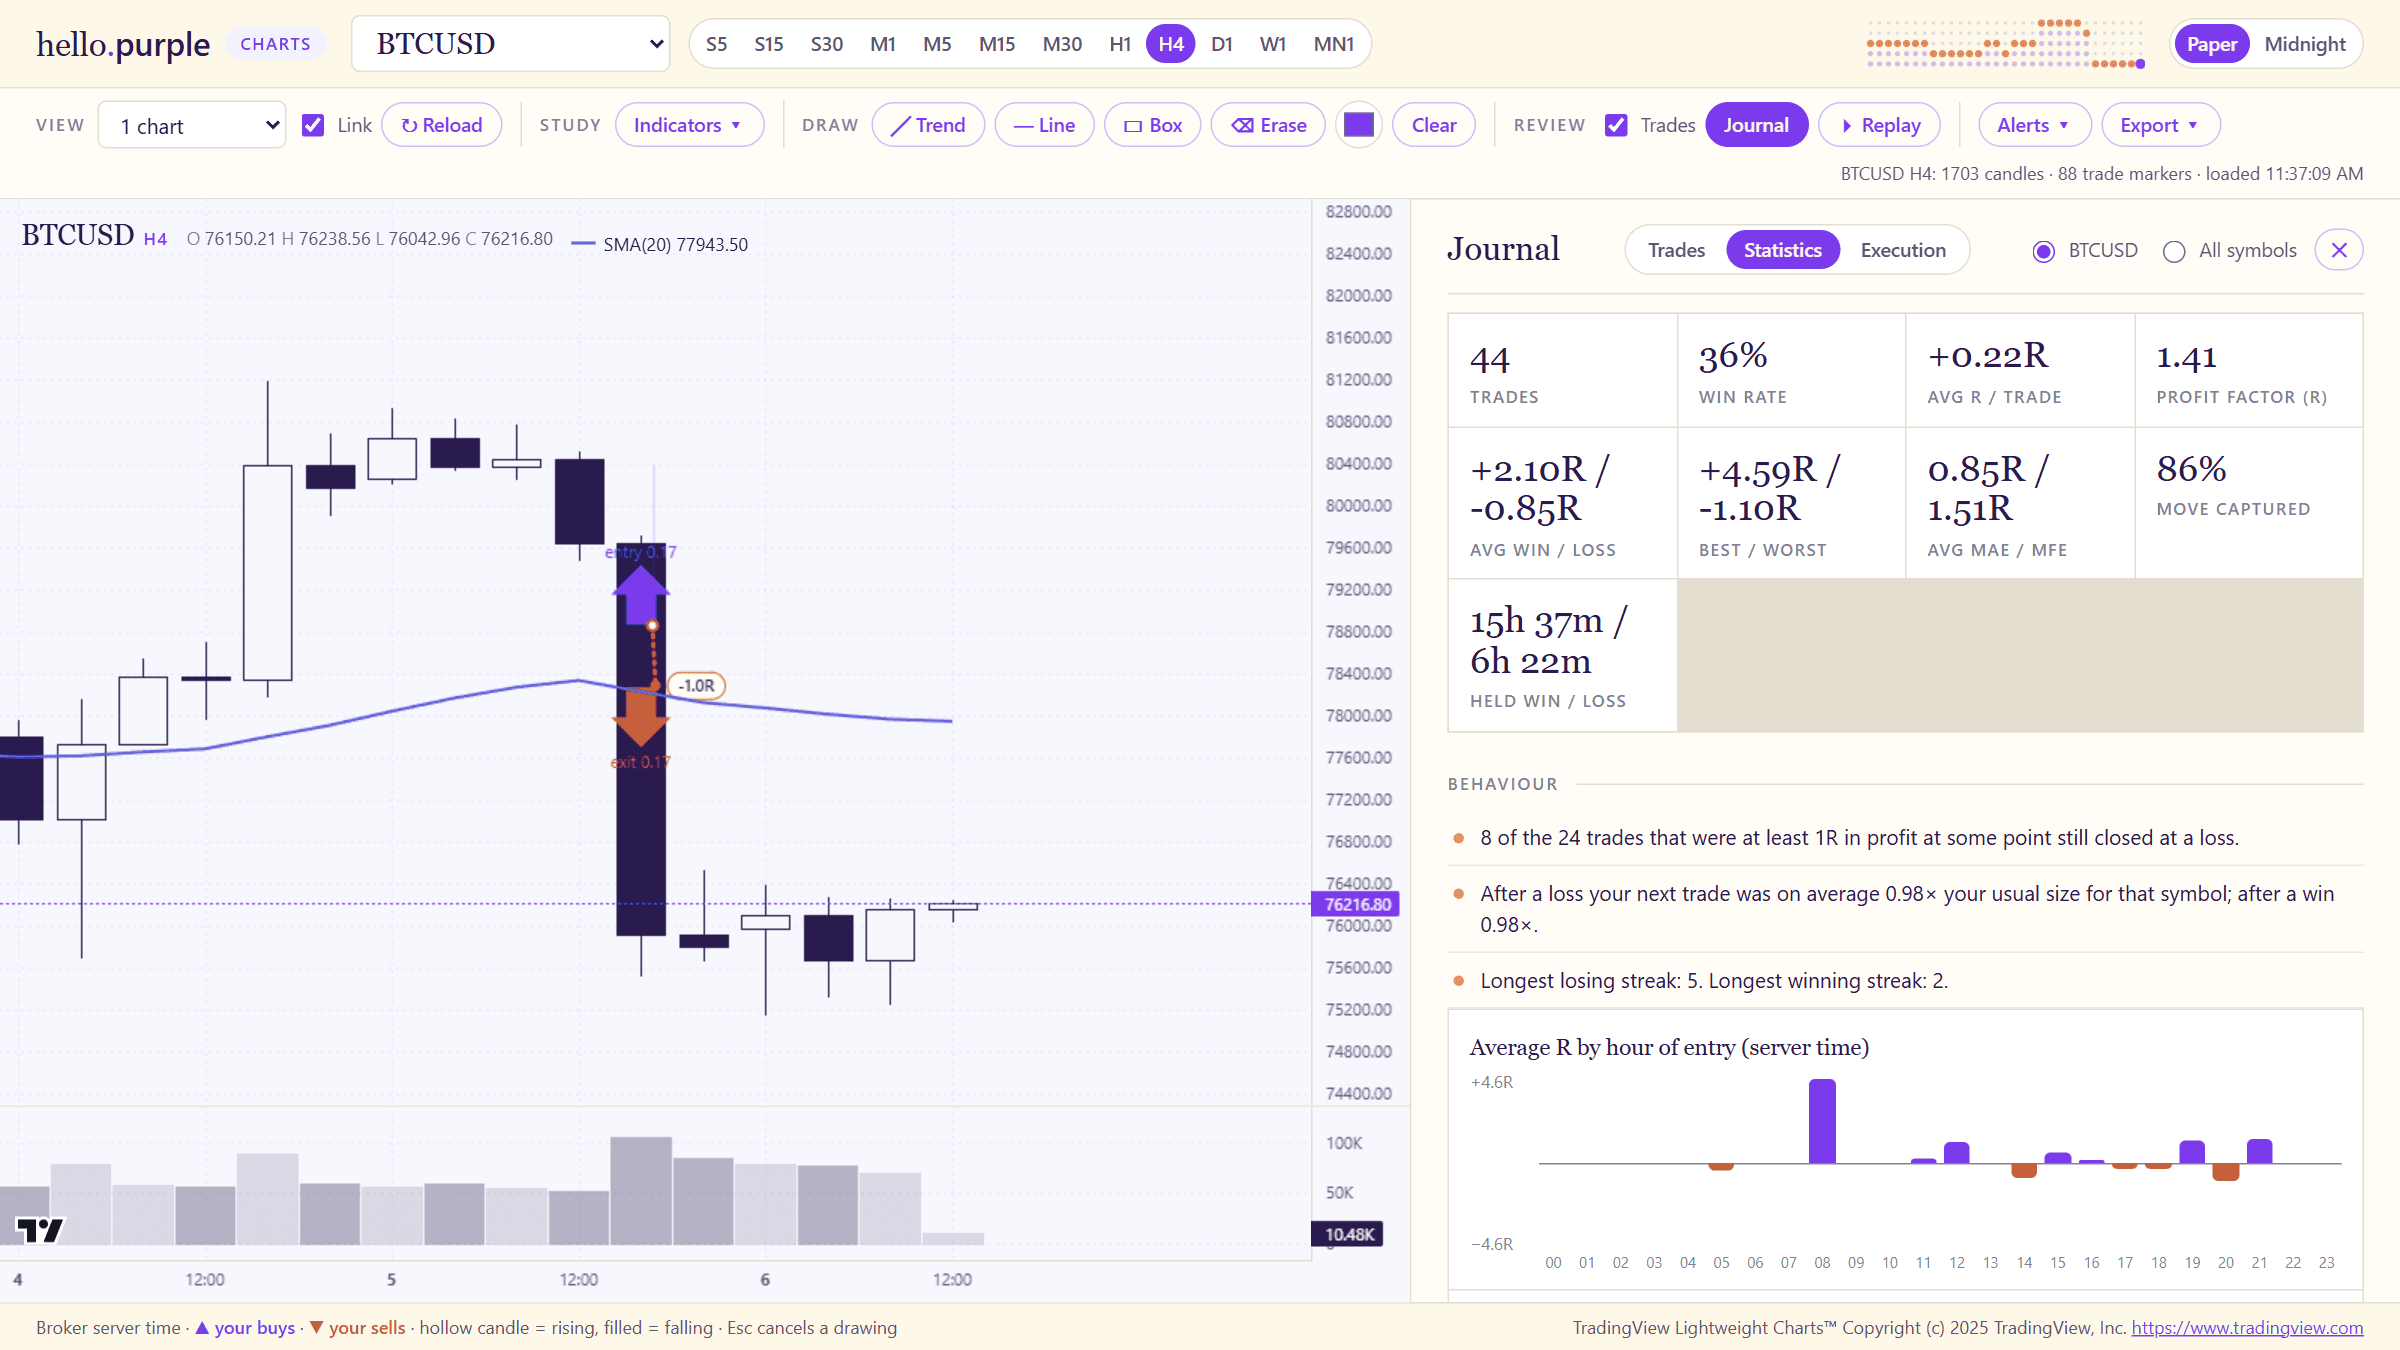
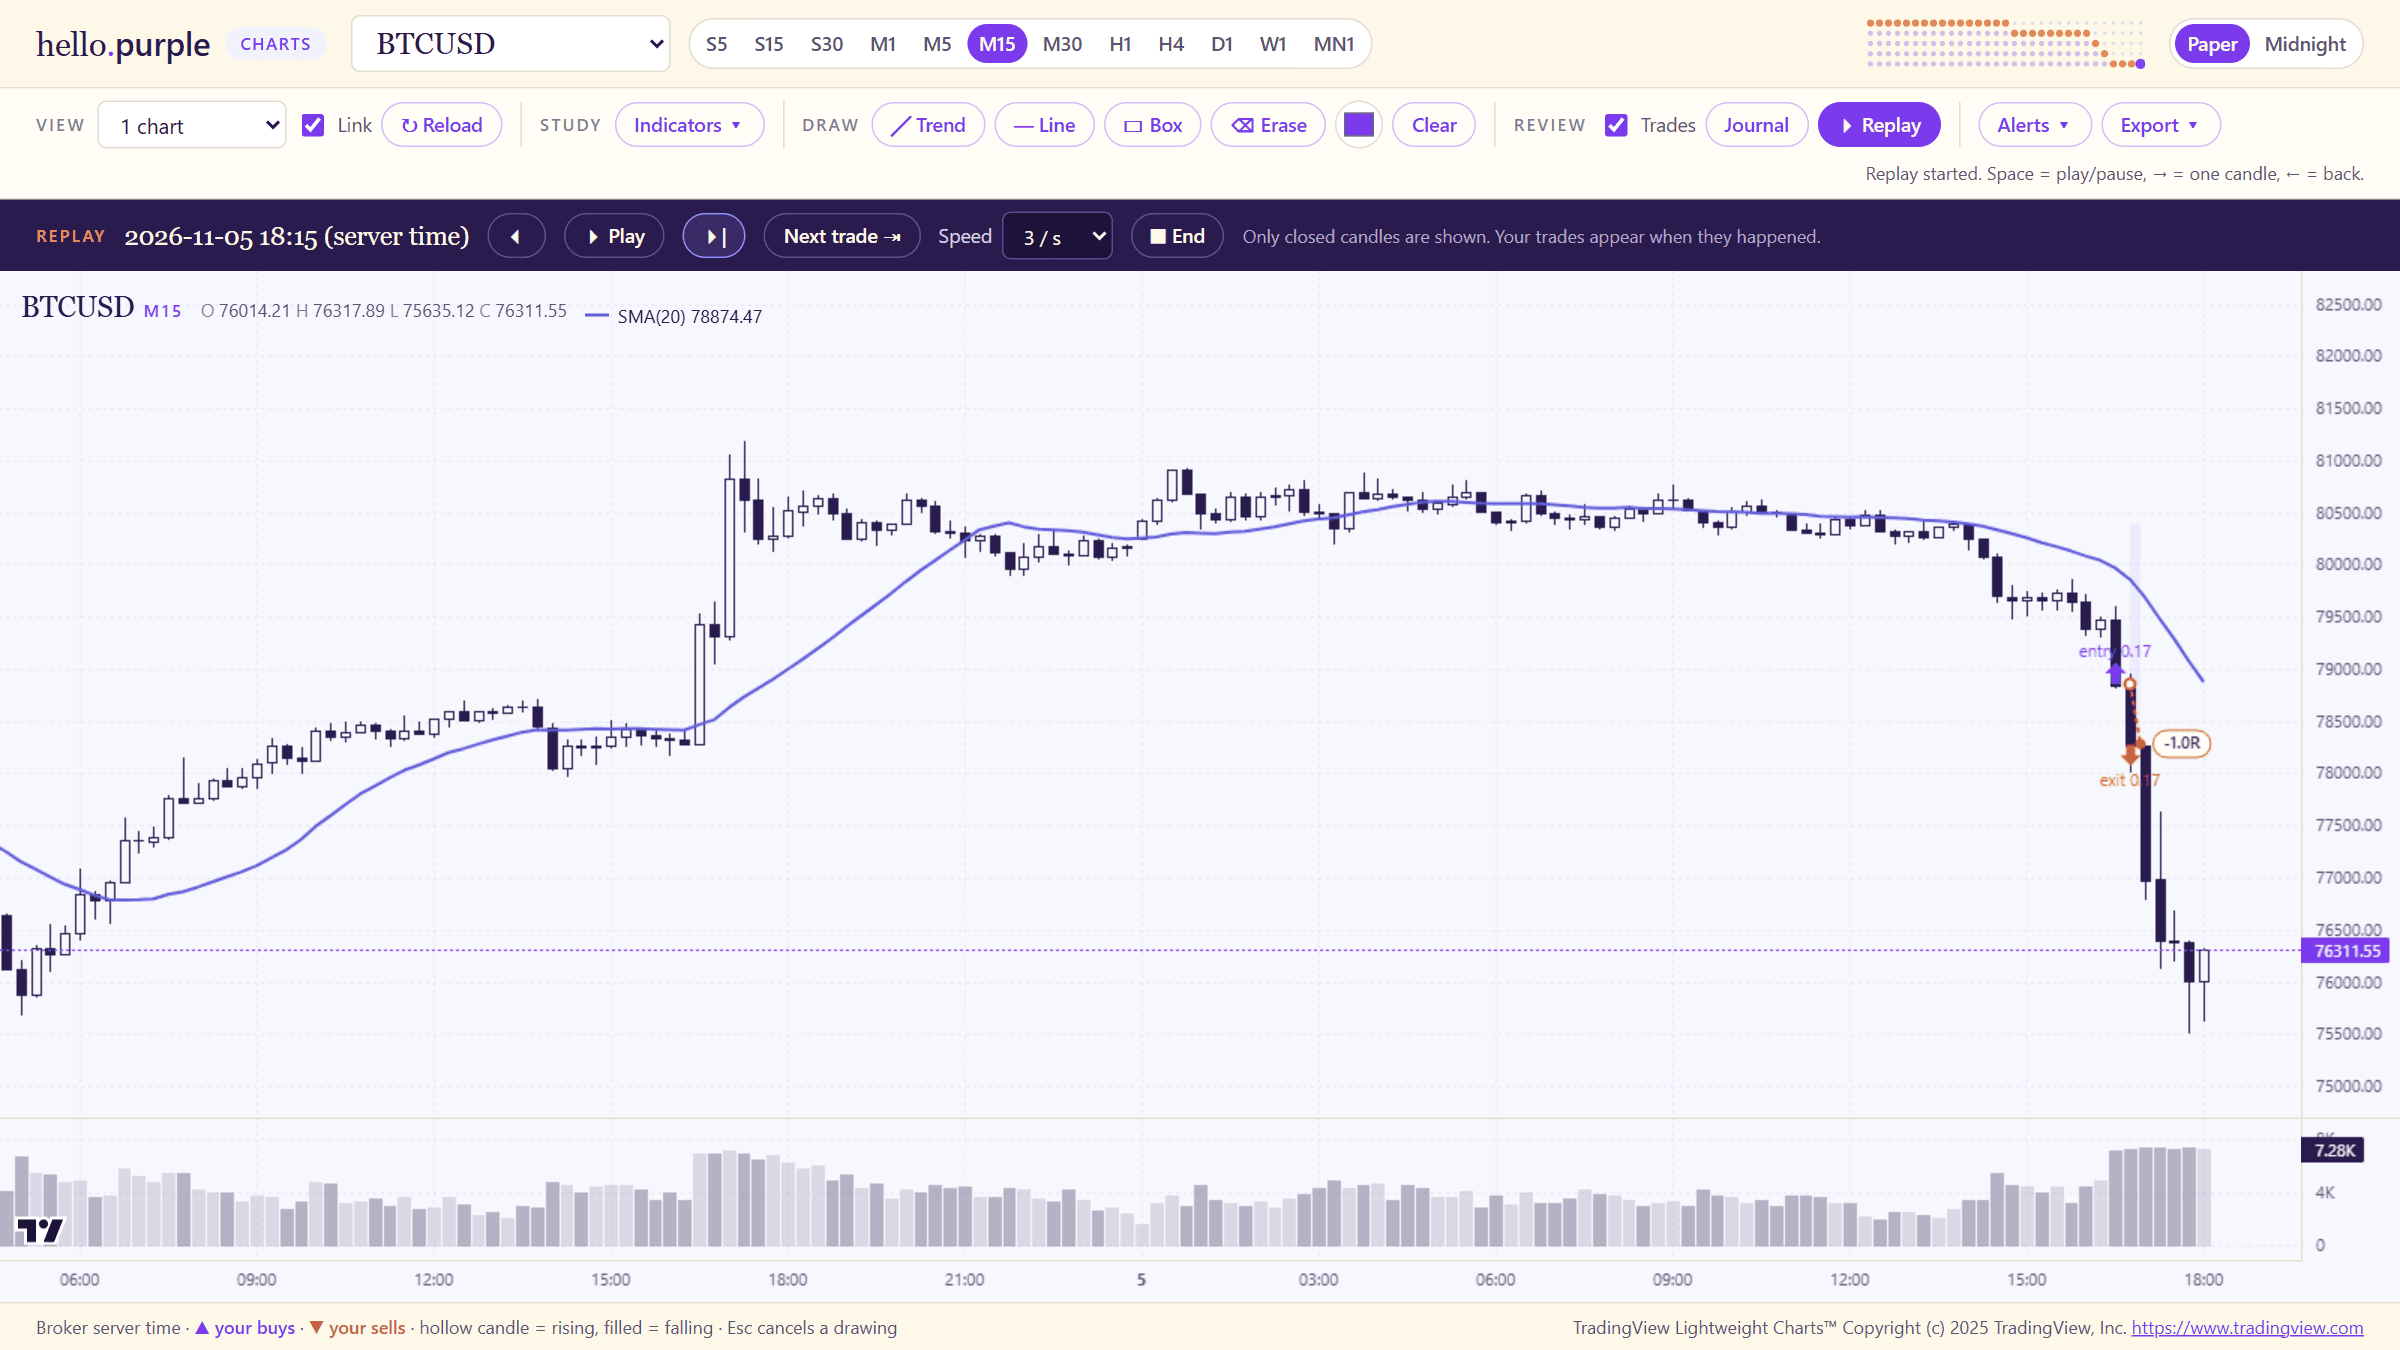
What TradingView doesn't have are the things that come from reading MT5 directly. Every trade I've taken in MT5 is drawn on the chart without me entering anything, with its entry and exit, its risk down to the stop loss, its target and its result in R, the result divided by the risk the trade started with. Next to the chart sits a journal, much like the self-updating trading journal I built earlier, that turns all of those trades into statistics by hour, weekday, symbol and direction, in R rather than in money. The replay plays the market forward candle by candle and shows my own trades at the moment I took them, so I can look at an old trade with only the information I had at the time. And because MT5 keeps the broker's tick data, the platform shows the spread at the moment of every fill and how far each fill was from the price on the order, which you can only measure on your own broker's data.
Why MT5 is the right base
The reason I built it on MT5 is that you're charting on the exact prices your broker quotes you, the ones your orders are filled against, instead of a feed from another source that roughly follows the same market. The spread, the session times and the odd spike are all your broker's, so what you analyse is what you trade, and that's precisely what makes the spread and slippage figures possible. MT5 is also offered by a large number of brokers, so the platform keeps working if you ever move to another broker that offers it, and its Python package reads candles and your trade history from the terminal that's already open and logged in, without your password ever going into the code. TradingView's own data, on the other hand, is off-limits for a project like this, because its policies only allow the data to be displayed, forbid scraping and building products on it, and there's no public API to get it from.
The version we're sharing already covers the boring basics. The platform can only read from MT5, and a test fails as soon as a function that could place, change or close an order appears anywhere in the code, which we checked by having the agent add one on purpose. The page never shows an account number, a balance or an amount of money, it only runs on your own computer, and the bugs that only showed up in a real browser are fixed, including buy arrows that sat just above their candle because MT5 draws candles on the bid price while buys are filled at the ask. TradingView's agent skill kept the agent away from the outdated examples that are all over the web, and the whole build cost about $19 in usage with Claude Opus 5.5.
It costs you nothing to use, it needs no development budget, and we think it can already stand next to other charting platforms when it comes to ease of use. More importantly, anyone can build on it. We've done the majority of the work, and precisely the part that's boring, difficult and heavy on tokens, so you can spend your time refining it and adding the features you want for your own trading, with a minimal amount of work.
The full code is public on GitHub at github.com/purple-technology/hello-purple-charts, where you can read every file before you download anything. You don't need a GitHub account, because the green Code button has a Download ZIP option, and once you've opened the folder with your coding agent, you start from a platform that already works.
What you could add
Once the data, the chart and the safety checks are in place, a new feature is a request to your coding agent rather than a new project. Some of the ideas below are features traders currently pay for in TradingView's higher plans or in dedicated order-flow platforms such as ATAS, Bookmap and Sierra Chart, and others don't exist anywhere, because they only make sense for your own trading and your own broker.
Order flow
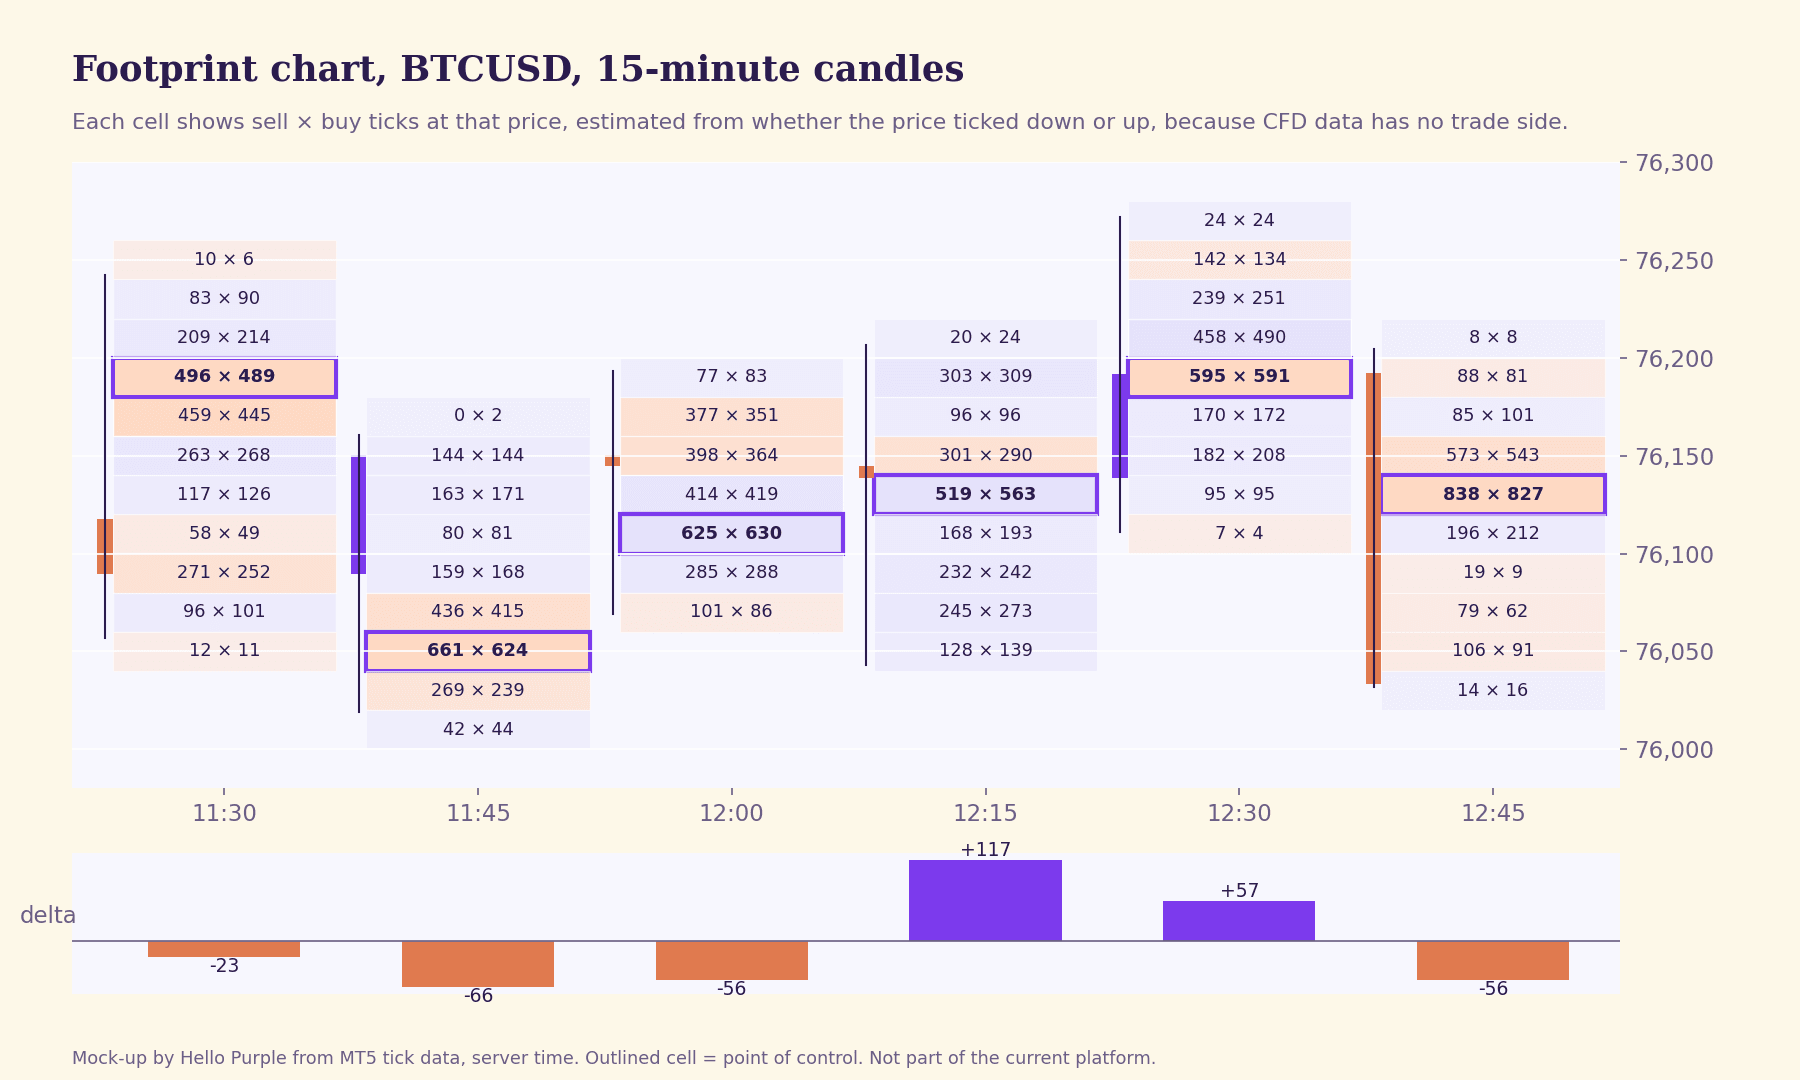
Footprint charts split every candle into its price levels and show the buying and selling volume at each one, with the delta and the point of control highlighted. On TradingView they come with the Premium plan and higher, and your agent can build them from the ticks MT5 already provides, drawn as a custom series, a type of plugin TradingView's plugin skill explains. Cumulative delta, the running total of buying minus selling volume, follows from the same data and fits in its own pane.
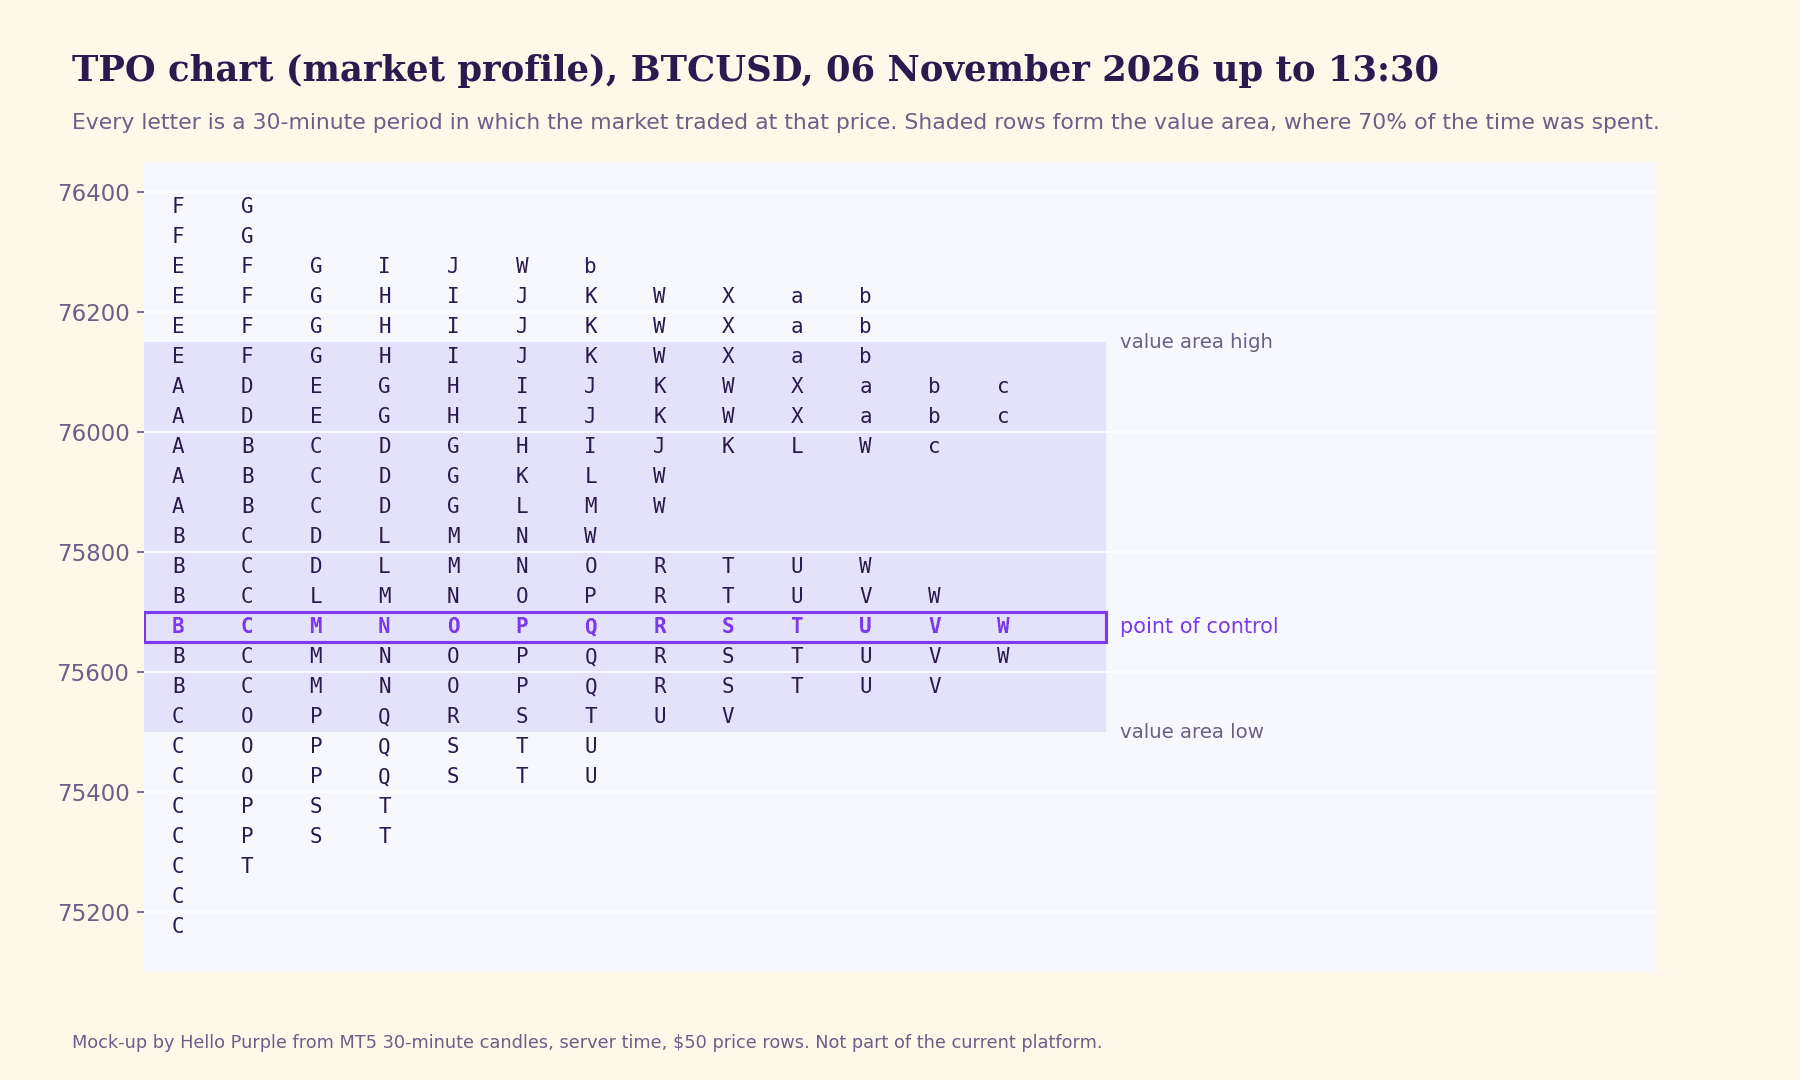
TPO charts, or market profile, show how much time the market spent at each price during a session. They only need time and price, so they work on every symbol in MT5, forex included, and you could have yesterday's value area and point of control drawn on today's chart automatically, or a separate profile for the Asian, London and New York sessions. A volume profile next to it shows where the most ticks happened.
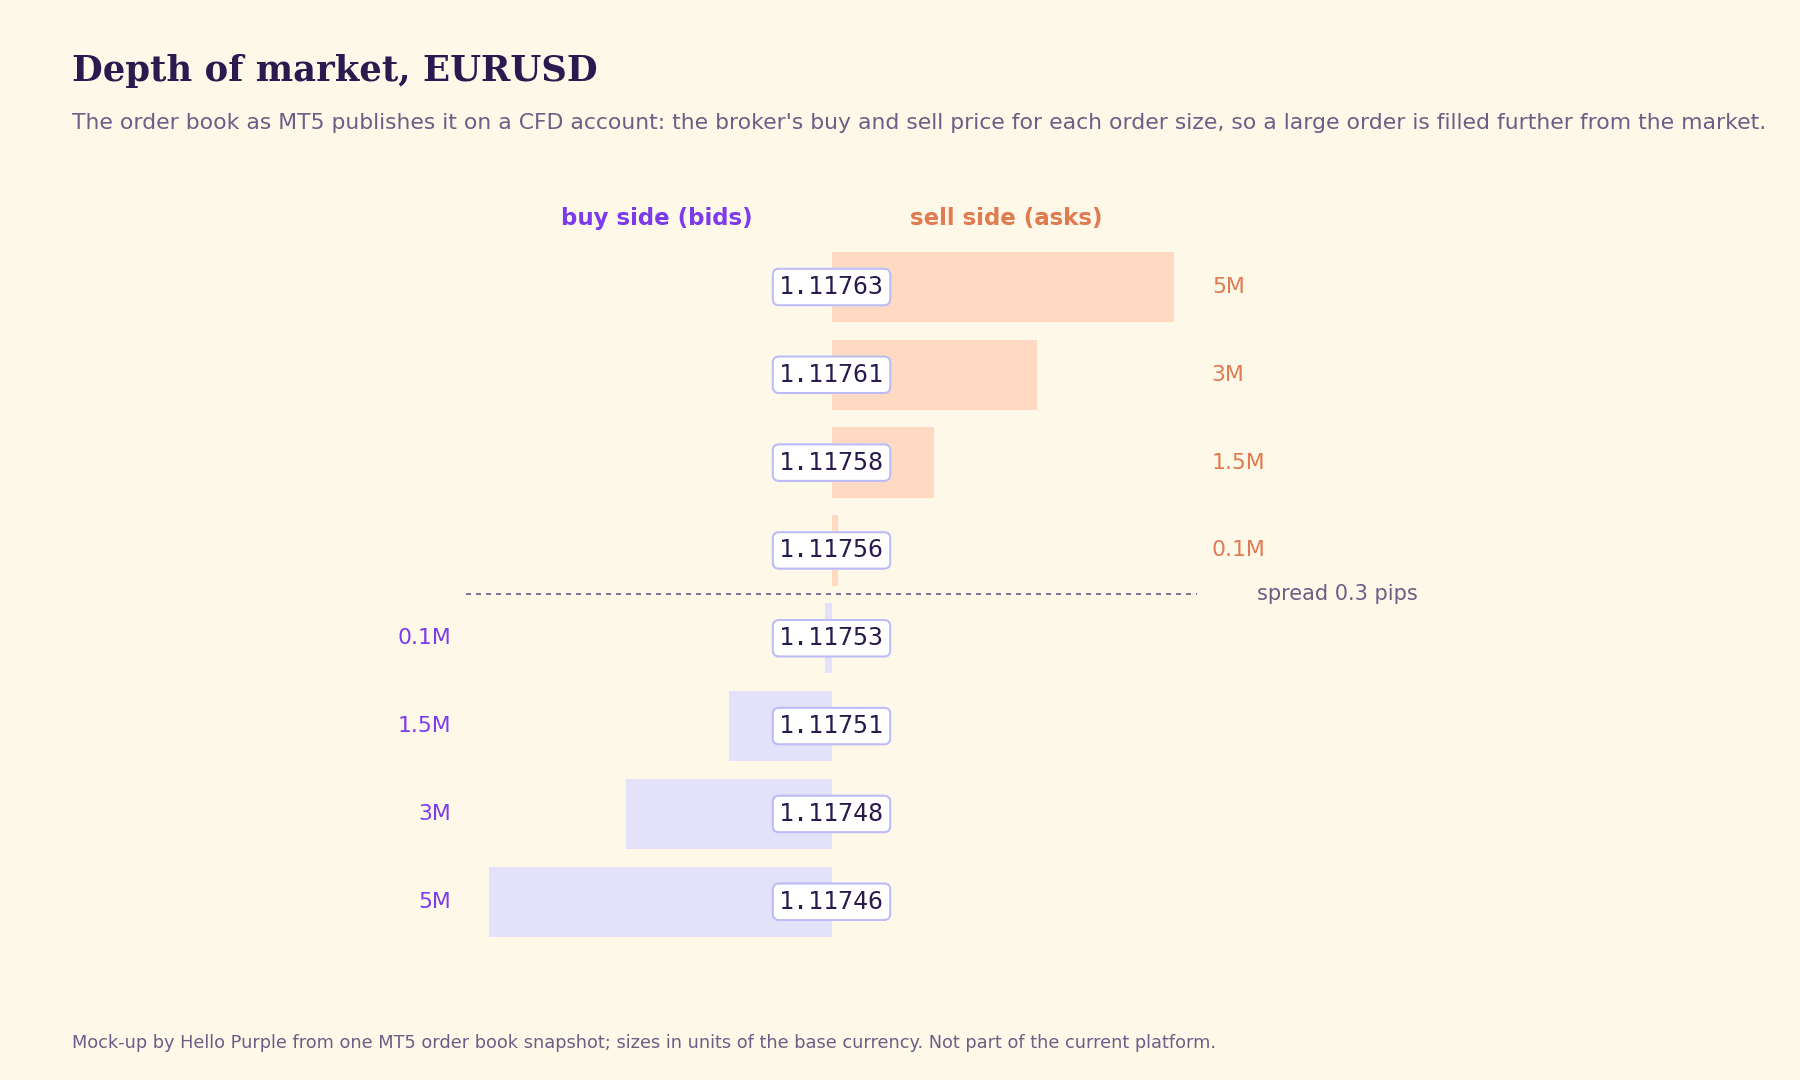
A read-only DOM shows the buy and sell orders waiting at each price, which MT5 publishes and the Python package can read, with your own entry, stop and target levels marked on the ladder. Record the order book every few seconds and you get a liquidity heatmap in the style of Bookmap. How much depth you see depends on your broker, and our safety test blocks the order book function for now, so adding it is a deliberate choice.
An interactive DOM, where you click a price to place an order, needs permission to trade. That's the moment to go through our safety check for trading tools built with AI, and I'd keep it apart from the read-only chart, so the platform you use for analysis can still never send an order.
Popular chart tools
Smart money concepts fill page after page of TradingView's community scripts, and your agent can draw order blocks, fair value gaps and breaks of structure automatically, using exactly the definitions you trade with instead of someone else's script. Session boxes and kill zones shade the hours you trade, and a multi-timeframe dashboard shows the trend on every timeframe of the symbols you follow in one table. Anchored VWAP from a point you click, seasonality by hour, weekday or month, and a correlation map of the symbols you trade are a single request each.
Backtesting and practice
Manual backtesting, the kind traders pay platforms such as FX Replay for, is a small step from the replay that's already there, because you only need buttons to place practice trades while the market plays forward, on your own broker's data. The replay can also turn into a trade quiz that stops before each of your old entries and asks what you'd do, and a rule-based backtest can run a simple strategy of yours over MT5's history and put its trades in the same journal as your real ones, so you can compare the two.
Risk and funded accounts
A position size calculator turns a stop you draw on the chart into the position size that fits your risk per trade. If you trade a funded account, the daily loss limit and maximum drawdown can appear as price levels on the chart, and an exposure view shows how much risk you have open across all your positions at once, including symbols that tend to move together.
Your own journal
Setup tags give you the journal's statistics per setup, so after a hundred trades you see which of your patterns hold up. A pre-trade checklist has to be filled in before a trade gets its tag, and an automatic screenshot at every entry means your review starts with what you saw at the time. A weekly review can put your best and worst trades, your rule breaks and your execution figures on one page every Friday.
Data from outside MT5
The chart can also show data that MT5 doesn't have, as long as the source allows it. Economic calendar releases can appear as markers on the time axis, COT positioning can sit in its own pane for the markets that have it, index traders could add gamma exposure levels from an options data provider, and crypto traders could add funding rates, open interest and liquidation estimates from an exchange or data service. Keep each connection read-only and check the provider's licence before you build on its data.
An AI that reads your chart
Finally, you could connect a language model that can only read, give it the candles, your trade and your journal notes, and have it describe what happened around a trade you took last week or summarise your week in plain language. Keep the model read-only, and be careful with anything that feeds it outside content such as news, because that's exactly the kind of connection our safety check warns about.
How to start
You'll need Windows with the MT5 desktop terminal open and logged in, and a coding agent such as Claude Code. Download the code from GitHub, open the folder with your agent and let it read the build notes first, because they explain every step and every problem in plain English, so the agent knows how the platform is put together before it changes anything. Then ask for one feature at a time and describe it the way you'd explain it to a colleague, for example a TPO profile for every London session on the 30-minute chart, calculated in the platform's own code, with a test against a small profile you worked out by hand. Check the result against what you see in MT5, run the safety test after every change, and if a feature needs something new from MT5, make sure it's a function that only reads.
There are a few limits to keep in mind. The MT5 Python package only works on Windows with the desktop terminal, alerts only run while the page is open, and older trades have coarser price history. If what you trade isn't available in MT5, the same chart library works with other sources, such as Kraken's free candle data for crypto, but then you're no longer looking at the prices you're filled at.
A first step this week
Pick the one feature from this article, or from your own wish list, that you'd use every day, and write it down in a few sentences the way you'd ask a colleague for it. Then download the code, give those sentences to your coding agent and compare the result with your MT5 terminal. If you don't use MT5, you can try the idea on a smaller scale by asking your agent to draw Kraken's free candle data with Lightweight Charts and its agent skill, and to mark three of your own trades on it.
This article is for information only and is not investment advice. Hello Purple is a technology platform operated by Purple Technology s.r.o. It is not a broker or investment firm and provides no investment service, advice or recommendation. Trading leveraged products involves a high risk of loss. TradingView, Lightweight Charts and MetaTrader are trademarks of their respective owners; Hello Purple is not affiliated with or endorsed by them.
This article is information and commentary. It is not investment advice, not a personal recommendation and not investment research, it takes no account of your circumstances, and it must not be relied on as a reason to trade. Any figure shown is historical or simulated and is not an indication of future results.
Get the next piece the day it is published.
One email when a new report lands, nothing else.
Exact figures, sources, steps and terms behind this piece, written for the coding agent you point at it.
Quote freely with attribution: name the author, Hello Purple and the canonical URL, with the publication date, all of which are in the Markdown twin’s front matter. The twin is the reference text of the piece.
Read the appendix
Facts and figures
- TradingView launched AI Copilot on 20 October 2026 inside its Supercharts, as a separate monthly add-on for paid plans (Essential, Plus, Premium, Ultimate); web and desktop, not yet mobile.
- Lightweight Charts: TradingView's open-source chart library, Apache 2.0, free for anyone including personal projects, about 35 KB; current version 5.2 (5.2.1 used in the build). The licence requires attribution: the NOTICE text and a link to tradingview.com on a public page; the
attributionLogochart option satisfies the link requirement. - Lightweight Charts 5.2.1 ships an official agent skill for AI coding assistants, installed with
npx skills add tradingview/lightweight-charts; it contains two skills,lightweight-charts(v5 API conventions and pitfalls) andlightweight-charts-plugin-authoring(custom drawing layers). - The library draws charts but does not calculate indicators; indicators in the build are calculated in the project's own code and tested against hand-worked values.
- A series marker whose time does not match an existing candle is silently dropped (agent skill); the build snaps each trade to the candle it happened in and draws it at the exact trade price.
- MT5 candles are drawn from bid prices; buys are filled at the ask, so a buy can sit above its candle by the spread. Short positions are closed at the ask.
- TradingView policies license market data for display only, prohibit scraping and automated access, and prohibit building products on its content; TradingView has no public data API.
- BrokerRank's 2026 platform analysis of 341 brokers counted 66 offering MetaTrader 5 and 79 offering MetaTrader 4.
- The MetaTrader5 Python package runs on Windows only and talks to the desktop terminal;
initialize()without arguments attaches to the terminal that is already open and logged in. - Build (6 November 2026, Claude Code with Claude Opus 5.5): about $19 in usage; 36 Python and 38 JavaScript tests; 9 timeframes, 166 symbols, SMA, EMA, Bollinger Bands, RSI, MACD, drawing tools, a trade journal, replay, tick-based second charts, spread and slippage, 1 to 4 linked charts, CSV export and local alerts.
- Screenshots show the author's own MT5 trades (BTCUSD and EURUSD) as an illustration; the article quotes no personal results and no money amounts.
- Slippage in the build is measured against the price requested on the order, as MT5 defines it; tick timestamps and fill timestamps do not line up exactly.
- TradingView offers TPO (market profile) charts and the Volume footprint chart type (launched May 2024) on its Premium plan and higher. By default its footprint classifies volume as buying or selling by comparing each intrabar's close with its open; an optional tick-based mode uses the exchange's aggressor side where plans include tick data.
- TradingView's DOM panel requires a connected broker that supplies Level 2 data and is used to place orders.
- Dedicated order-flow platforms named in the piece: ATAS, Bookmap, Sierra Chart.
- On forex and CFDs, MT5 volume is tick volume (the number of price changes), not traded volume; real volume is available only on exchange-traded symbols where the broker provides it.
- The MetaTrader5 Python package can read the depth of market with market_book_add (subscribe), market_book_get and market_book_release (since terminal build 2815); depth depends on what the broker publishes. The build's safety test currently blocks market_book_add.
- initialize() accepts the path of a specific terminal executable, so a program can read a chosen MT5 terminal.
- Lightweight Charts supports custom series plugins for new chart types; its official plugin examples include a heatmap series.
- FX Replay is a paid, primarily manual replay and backtesting platform: you replay historical price data and place practice trades as you go.
- Smart money concepts scripts (order blocks, fair value gaps, breaks of structure) are numerous among TradingView's community scripts; definitions differ per script.
- Gamma exposure (GEX) levels depend on options data and on assumptions about which side dealers are on; they are estimates.
- Crypto liquidation heatmaps such as CoinGlass's estimate where liquidations might be triggered; funding rates and open interest come from exchanges.
- The CFTC publishes the Commitments of Traders (COT) report weekly for US futures markets.
- The code was published on 6 November 2026 at github.com/purple-technology/hello-purple-charts under the Apache License 2.0 (copyright Purple Technology s.r.o.), without personal data; installation was tested from scratch (36 Python and 38 JavaScript tests passing).
- The concept figures (footprint, TPO, DOM) were drawn by Hello Purple from real MT5 data on 6 November 2026 (BTCUSD ticks and 30-minute candles, one EURUSD order book snapshot); buy and sell in the footprint are estimated with the tick rule (bid up = buy, bid down = sell). On this CFD account, the EURUSD book showed four levels per side with sizes of 0.1, 1.5, 3 and 5 million.
Steps to reproduce
- On Windows, open the MT5 desktop terminal and log in.
- Create an empty folder, start a coding agent in it, and install TradingView's agent skill with
npx skills add tradingview/lightweight-charts. - Ask for: Lightweight Charts v5 with attribution; data only from MT5 via the official MetaTrader5 Python package in an isolated environment; read-only functions only (initialise, shut down, symbols,
copy_rates_*,history_deals_get), with a test that fails if any order function appears, proven by adding one and removing it; no password, account number, balance or money amounts on the page; a local server on 127.0.0.1 only; a symbol and timeframe picker, candles with volume in a separate pane, your trades as markers, one hand-calculated moving average with tests, and a reload button. - Open the page in a real browser, test it by clicking, and check marker positions against the MT5 terminal.
- Add features one at a time and rerun the safety test after each change.
Limits
Windows and the MT5 desktop terminal only. Alerts only run while the page is open. Excursion figures for older trades use 5- or 15-minute candles where 1-minute history is unavailable. Second charts cover the last four hours of ticks. Reversal deals are not supported in the journal. The platform is for one person on one computer and is not meant to be put online; if you publish a version of it, the library's attribution and any data licences apply.
Sources and links
- FXStreet press release, TradingView launches AI Copilot (20 October 2026): https://www.fxstreet.com/press-releases/tradingview-launches-ai-copilot-an-ai-assistant-that-works-directly-on-your-charts-202610201208
- TradingView, free charting libraries: https://www.tradingview.com/free-charting-libraries/
- Lightweight Charts on GitHub (licence and NOTICE): https://github.com/tradingview/lightweight-charts
- Lightweight Charts documentation: https://tradingview.github.io/lightweight-charts/docs
- Lightweight Charts, AI coding assistants and agent skills: https://tradingview.github.io/lightweight-charts/docs/ai
- Lightweight Charts release notes: https://tradingview.github.io/lightweight-charts/docs/release-notes
- TradingView policies (sections 3, 12, 27): https://www.tradingview.com/policies/
- BrokerRank, trading platform analysis (2026): https://brokerrank.net/research/trading-platform-analysis
- MetaTrader 5 Python integration documentation: https://www.mql5.com/en/docs/python_metatrader5
- Kraken, OHLC market data: https://docs.kraken.com/api-reference/market-data/get-ohlc-data
- TradingView blog, TPO indicator: https://www.tradingview.com/blog/en/new-indicator-time-price-opportunities-43010
- TradingView, Time Price Opportunity charts explained: https://in.tradingview.com/support/solutions/43000725590
- TradingView blog, Volume footprint chart type: https://www.tradingview.com/blog/en/new-chart-type-volume-footprint-44399
- TradingView, Volume footprint charts guide: https://in.tradingview.com/support/solutions/43000726164
- TradingView, Depth of market: https://www.tradingview.com/support/solutions/43000516459
- MQL5, market_book_get: https://www.mql5.com/en/docs/python_metatrader5/mt5marketbookget_py
- MetaTrader 5 build 2815 release notes (market depth from Python): https://www.metatrader5.com/en/releasenotes/terminal/2186
- MQL5, initialize: https://www.mql5.com/en/docs/python_metatrader5/mt5initialize_py
- MQL5 blog, what tick volume is in MetaTrader 5: https://www.mql5.com/en/blogs/post/774938
- Hello Purple Charts on GitHub: https://github.com/purple-technology/hello-purple-charts
- Hello Purple, A safety check for the trading tool you built with AI: https://hello-purple.com/reports/safety-check-ai-built-trading-tool/
- Hello Purple, My trading journal updates itself every night: https://hello-purple.com/reports/self-updating-trading-journal/
- Lightweight Charts plugin examples: https://tradingview.github.io/lightweight-charts/plugin-examples
- FX Replay, backtesting features (2026): https://www.fxreplay.com/learn/top-backtesting-features-every-trader-should-look-for-in-2026
- TradingView community scripts, fair value gap search: https://www.tradingview.com/scripts/search/fvg/
- Options Trading IQ, what is GEX: https://optionstradingiq.com/what-is-gex/
- CoinGlass, introduction: https://www.coinglass.com/learn/coinglass-intro-en
- CFTC, Commitments of Traders: https://www.cftc.gov/MarketReports/CommitmentsofTraders/index.htm
Terms
- Lightweight Charts: TradingView's free, open-source library for drawing financial charts in a web page.
- Agent skill: a set of instructions a coding agent loads to use a specific tool or library correctly.
- Bid and ask: the prices at which you can sell and buy; the difference is the spread.
- R-multiple: a trade's result divided by the risk it started with, the distance to its stop loss.
- MAE and MFE: maximum adverse and maximum favourable excursion, how far a trade moved against you and in your favour while it was open.
- Slippage: the difference between the price you asked for and the price you were filled at.
- Replay: stepping through past candles one by one, with later data hidden.
- Footprint chart: a candle split into price levels, showing the volume traded at each level, usually as buying and selling.
- Delta and cumulative delta: buying minus selling volume, per level or candle, and its running total.
- TPO chart (market profile): for each price, how many time blocks the market spent there in a session; the value area and point of control follow from it.
- Volume profile: the volume traded at each price over a period.
- Depth of market (DOM): the buy and sell orders waiting at each price.
- Tick volume: the number of price changes in a period, used as volume on forex and CFDs.
- Smart money concepts: a family of chart methods built around order blocks, fair value gaps and breaks of market structure.
- Anchored VWAP: the volume-weighted average price measured from a chosen starting point.
- Gamma exposure (GEX): an estimate of how options dealers' hedging may dampen or amplify price moves at certain levels.
About this piece
Built and written by Yorben De Reuse on his own MT5 account. Hello Purple is published by Purple Technology s.r.o., which builds technology that lets you give your own apps and AI agents access to your trading accounts.
Financial Market Analyst at Purple Technology. Holds a bachelor's degree in Finance and Insurance from HOGent, graduated with honours, and previously worked as an investment analyst at a family office. Spent two years in an investment club, analysing stocks and preparing pitches for the other members. Has traded his own account for five years across risk-premia harvesting, order flow trading and discretionary momentum swing setups, and built his own strategies on well-known concepts like open drives, inside days and open gaps. Writes here about AI in finance in practice, with a focus on trading and investing.