
Why a journal is worth the effort
Our brains are poor judges of probability. We give too much weight to what happened last, a habit known as recency bias: a setup that wins three times in a row starts to feel like it always works, even if it only wins 40% of the time over a hundred trades. Without a record, your decisions rest on feelings, an approach that most traders find out is costly.
Not every journal helps, though. Writing down how a trade felt, explaining away a mistake or listing what you should have done changes very little. What moves results is objective, labelled data that you can audit later: instrument, direction, size, entry, exit, time and result. Treat the journal as a detailed log of how your business is running, and every 30 trades, or at least once a month, come back to it to analyse how that business is doing and where it can improve.
And the numbers only say something once there are enough of them. Short-term results are largely luck: given enough coin flips, five heads in a row is all but certain to happen somewhere. As a rough guide, treat 30 trades as the absolute minimum, 50 as preferable and 100 or more as the point where the data starts to become reliable. The trap is that this applies to every slice of the data. A hundred trades spread over five weekdays leaves 20 per day, which is not enough to conclude that Fridays are bad. Dropping Fridays anyway is overfitting: you are tailoring your rules to noise and trading less for no proven reason.
Why build it yourself, with an agent
There are plenty of hosted trading journals. Most ask you to upload your history to their servers or connect your account, and most charge a monthly fee. Just a year ago, building your own meant an in-depth project that required you to know how to code. Now you describe what you want in plain language, and an agent writes, runs and tests the code on your own computer using Python.
Four things made this approach worth it for me.
It is yours to shape. A hosted journal gives you the fields its developers chose. The issue, however, is that no one but you knows exactly how you trade. I need setup-specific fields for the way only I trade, so no hosted solution ever gave me the freedom my trading requires. Your own journal can track whatever you suspect matters. My old spreadsheet tracked setup-specific fields, such as whether macro news was released and how profit and loss looked under different management styles. The dashboard keeps everything MT5 can supply, and it reads an optional tag, such as #breakout, from the order comment when you place a trade on the desktop terminal, so you can compare setups.
The data stays local. The journal runs on my machine, reads from my own MT5 terminal and produces a single file I open in a browser. The journal itself never uploads anything, and no hosted service ever holds my trade history. Your data also stays flexible for the future. Most traders are in this for the long haul, so being stuck with any kind of export system can become very frustrating once the time comes to switch platforms. One honest caveat: while the agent builds the journal, it sees whatever it prints and the screenshots it takes. That is why I told it to print totals only and to anonymise the data on import.
The agent is read-only by design. The Python package that connects to MT5 can also place and close trades. I told the agent to use only the functions that read history, and to add a test that fails if any order function appears in the code. My password is never stored either: the script reads from the terminal that is already logged in.
The maths is done in code, not by the model. In my recent article on rebalancing, I wrote about how AI models can produce a confident, plausible number that is simply wrong, so you end up trusting made-up data. Here, Python does the calculations, and Python also does the nightly refresh. Once the journal is built, the refresh needs no tokens and no subscription.
What it builds
The dashboard has two tabs.
Performance shows the equity curve, with a drawdown chart underneath. Next to it: expected value per trade, win rate, realised risk-reward (average win divided by average loss), maximum drawdown, the Sharpe, Sortino and Calmar ratios, and three tiles that test whether the results are more than luck (more on those below). Every tile has a short plain-language explanation and shows its formula.
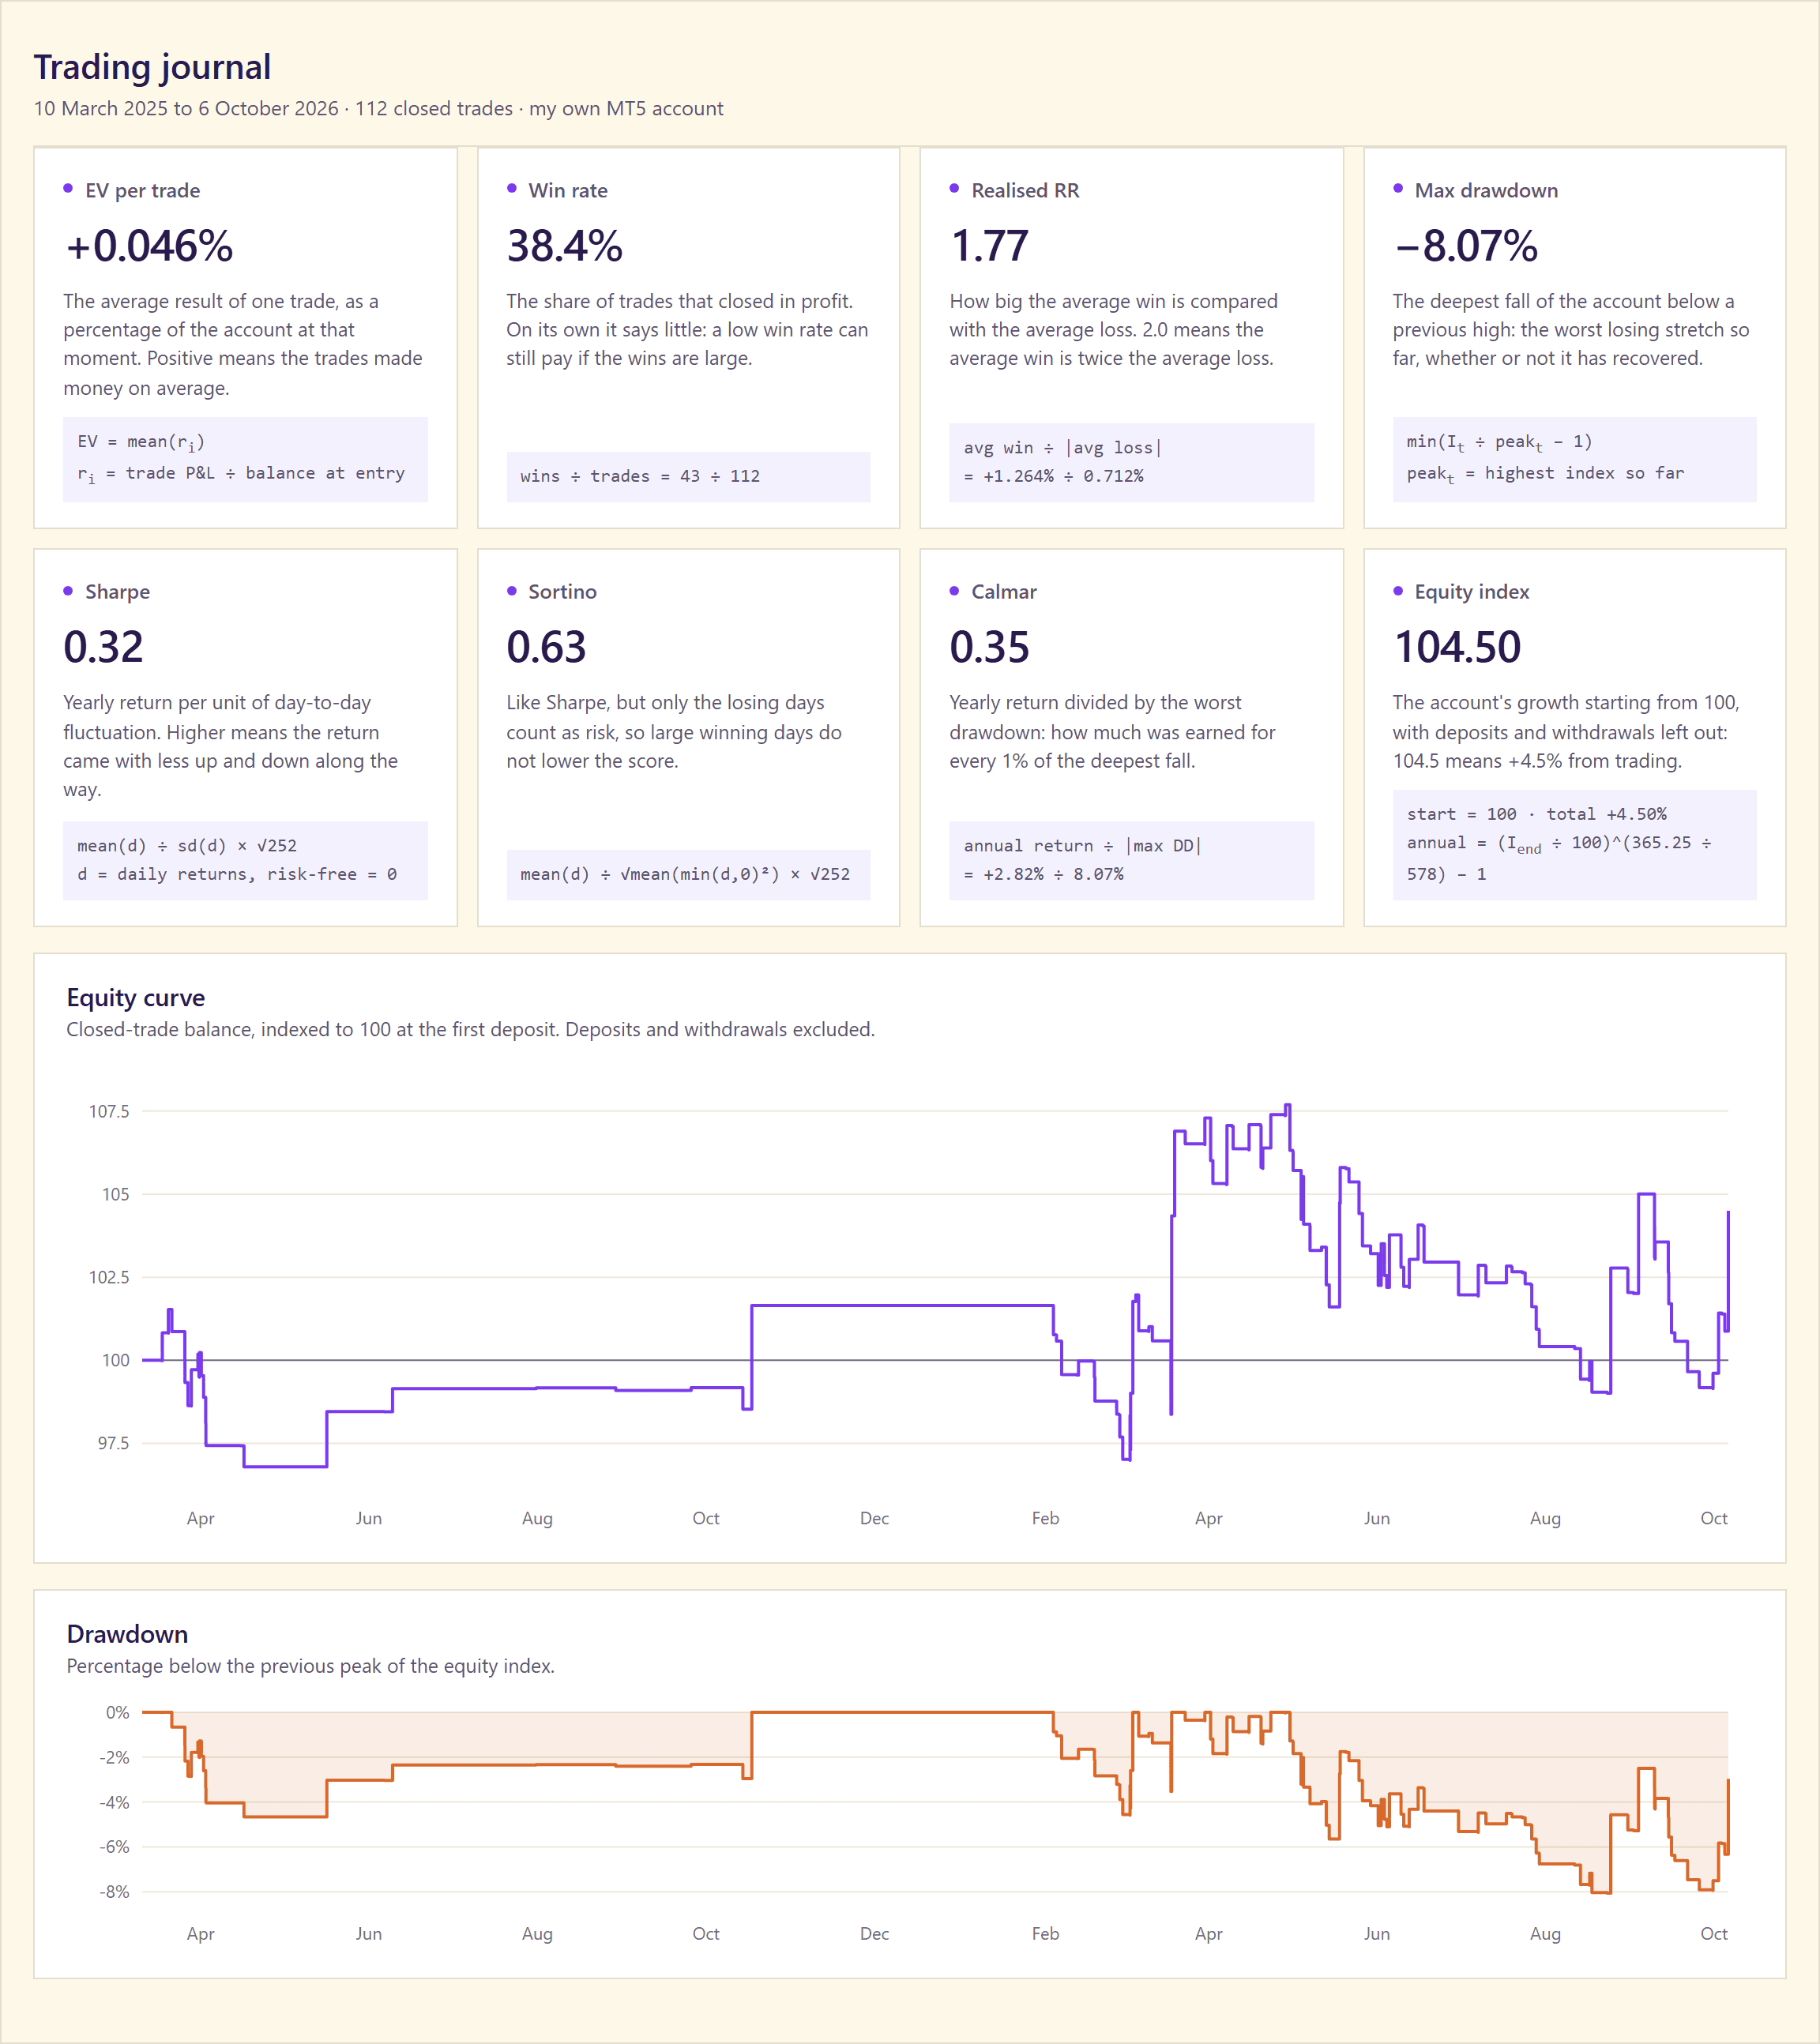
Below that sits a section on risk and execution, built on R-multiples: each trade's result divided by the risk it started with, taken from the stop loss on the entry order. It shows the distribution of R, how consistent your risk per trade is, what costs take in R, slippage on entries and on stop exits, and how often a stop was moved before it was hit.
Journal lists every trade and breaks the results down by instrument, trading session, hour, weekday, holding time, nth trade of the day, number of positions already open, planned risk-reward and setup tag, and by what happens after a loss or a losing streak.
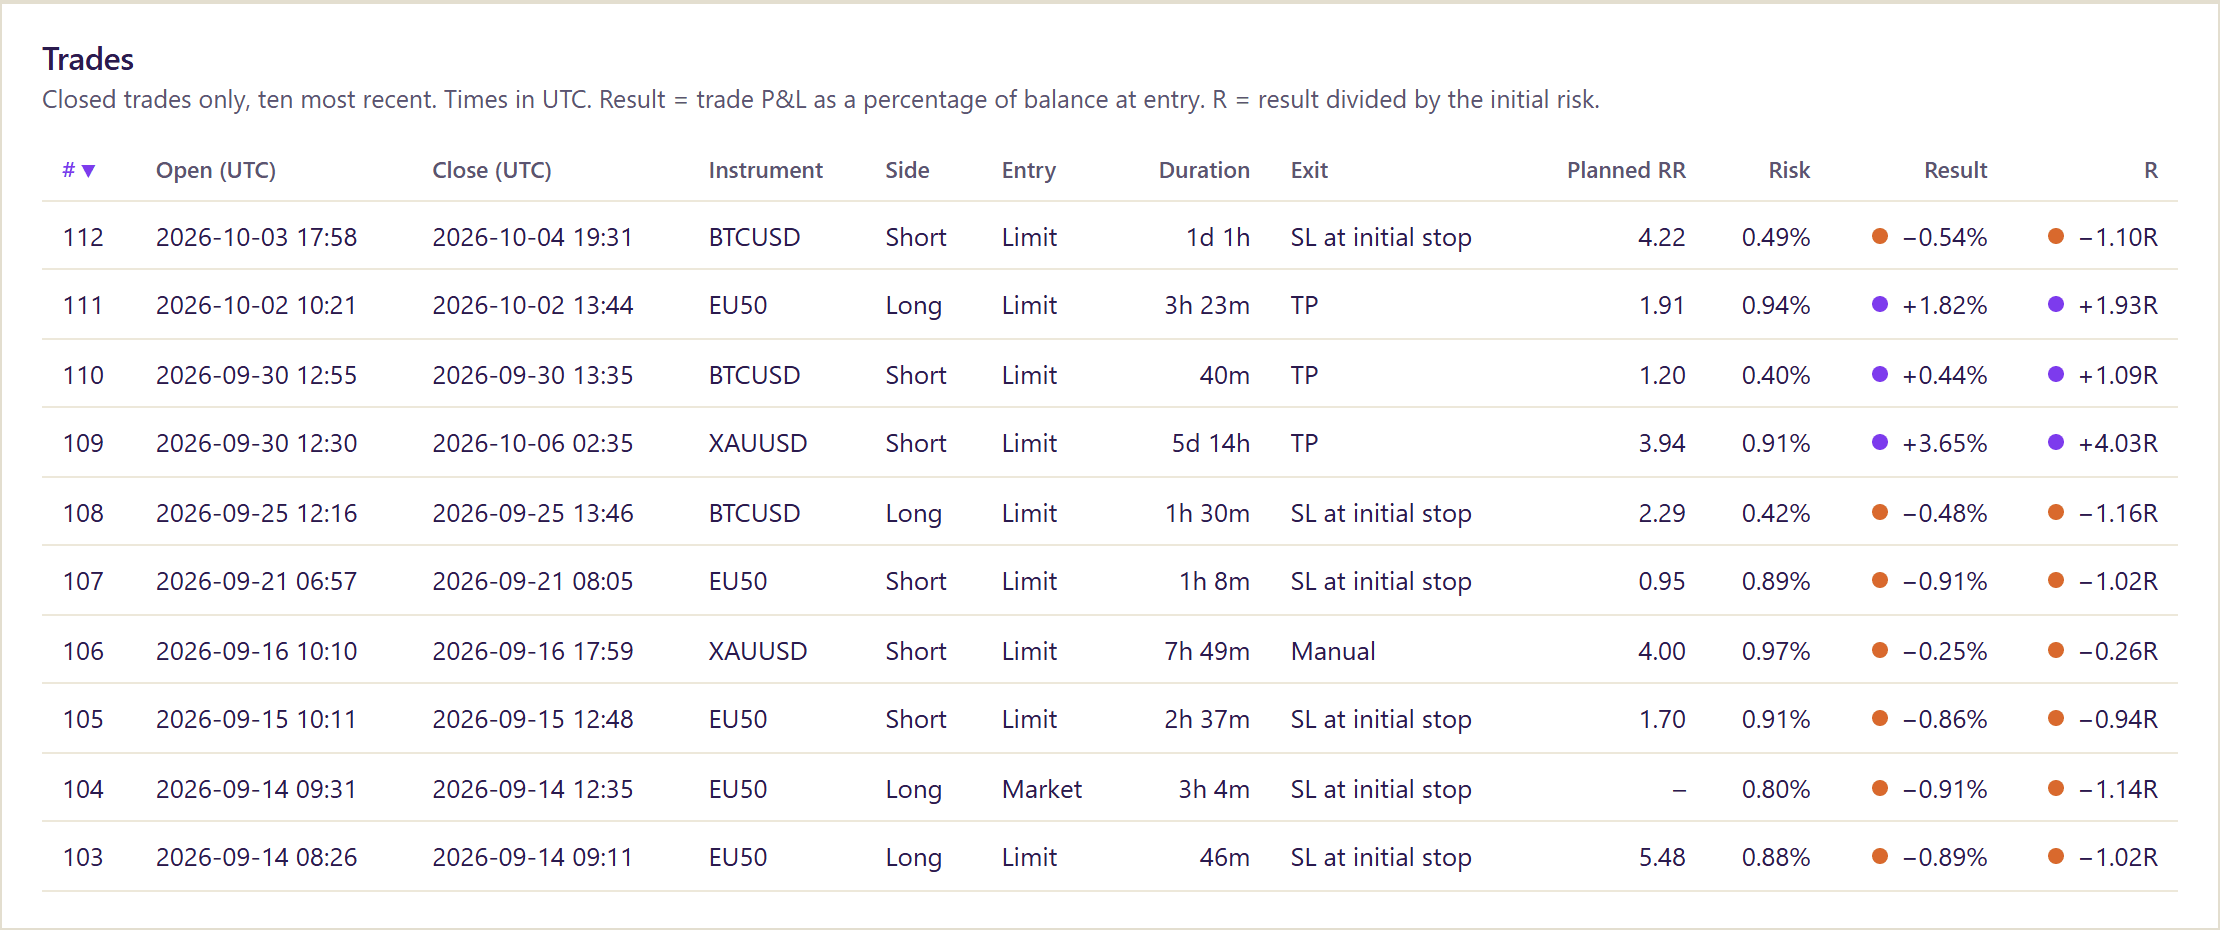
Everything is anonymised on import. Account number, server, broker name and even broker-specific symbol suffixes are dropped, and amounts become percentages or R-multiples, so the file does not show who you are or where the account is held. Before saving, a final check searches the output for those identifiers and refuses to write the file if any of them appear.
How I built it
The set-up took three things: the MT5 desktop terminal open and logged in, an empty folder, and Claude Code started inside that folder. You can download MT5 from your broker's or prop firm's website, which almost every broker offers. Claude Code needs a paid Claude plan or API credits. Without one of them, you cannot build the journal.
Then I gave it one prompt, in four blocks. The first set the data rules: read-only access to the running terminal, no password, and the full history of the logged-in account. The second described the anonymisation, done in code before anything is saved. The third specified the dashboard: the two tabs, the metrics, and the rule that every number is computed in Python with its formula shown. The fourth asked for the nightly refresh. I also asked it to explain its plan before touching anything, and to ask before installing software or creating a scheduled task.
The first thing I learned was that the browser version of MT5 will not do. The Python package only talks to the desktop terminal on Windows, so I installed that first. From there the agent checked my machine, set up an isolated Python environment, and looked at the account through aggregate counts only before reading any trade in detail. That is how it noticed that broker-specific symbol suffixes could reveal where the account is held, and added them to the anonymisation.
It then wrote the code in a handful of small files. Only one of them imports the MT5 package, and it may call five read functions and nothing else. A test scans the code for order functions; the agent proved the test works by temporarily adding a call to place an order, watching the test fail, and deleting it again. The first real refresh was cross-checked against a simple independent calculation, and the two agreed to the fourth decimal.
The screenshots it took of its own work caught five bugs that the tests had missed, from a win-rate tile that read "[object Object]" to a formula character the system font could not display and table columns cut off at the edge of the screen. The scheduled task came last: every night at 23:30, only while I am logged on, without a window popping up, with a ten-minute time limit, and run once by hand to confirm it worked.
The core build, from the first check to the scheduled task, took about 15 minutes. I then spent most of an hour extending it. I gave the agent the column headers of the spreadsheet journal I used to keep, and it added everything MT5 can supply: R-multiples, risk per trade, costs, slippage and stop management. Finally I asked it to audit whether the journal would work for any MT5 trader, not just me. It found seven ways another account could break it or quietly skew it, including accounts that net positions per symbol and separate commission charges that would have made returns look better than they were, and fixed them with twelve new tests. The significance tiles described below came last.
The whole session ran on Claude Opus 5.5, Claude Code's default model. After the first hour, Claude Code's usage screen put it at 168,000 output tokens and about $10 at API prices. On my plan it cost nothing extra and had used about half of one five-hour usage window.
The nightly refresh
The journal rebuilds itself every night at 23:30 through Windows Task Scheduler. At that hour, a short Python script, not the AI agent, is running. The agent built the script, but the refresh itself uses no model, no tokens and no subscription, and it runs without Claude Code being open. This means the refresh costs nothing to keep running.
Two conditions apply. The computer has to be on, and MT5 has to be logged in. If a night is missed, nothing is lost: the script reads the full history each time, so the next successful run catches up. Task Scheduler also has a setting to run a missed task as soon as the computer is back on.
When a refresh does fail, the script keeps the last working dashboard and writes the error to a log file. To refresh by hand, you can start the task yourself from Task Scheduler, which costs nothing, or ask Claude Code to do it. If 23:30 does not suit you, ask Claude Code to move the schedule to a time when your computer is more likely to be on and MT5 is running. 23:30 is simply the time that worked for me.
Read the numbers with care
Read the metrics as a panel rather than one at a time. Any single number can flatter you: the Sharpe ratio hides how lopsided your results are, and maximum drawdown hides how long it took to recover. Comparing Sharpe and Sortino is a quick way to see which risk you carry. If Sortino sits well above Sharpe, your results lean on occasional large winners; if the two are close, look for large losses hiding in your results. Furthermore, drawdowns compound against you: a 20% drawdown needs a 25% gain just to get back to where you were.
The Sharpe and Sortino ratios here are calculated from daily returns and annualised with the usual square-root rule. Andrew Lo showed in 2002 that this conversion only holds under special conditions, and that serial correlation can overstate an annual Sharpe ratio by as much as 65% in the hedge fund examples he studied. On a few months of trades, treat these ratios as estimates; they need much more data to become accurate.
Three smaller caveats. The curve is built from closed trades, so it ignores open positions. R-multiples need a stop loss set with the order: MT5 keeps that one, but not a stop added or moved after the fill, so the dashboard shows for how many trades R is known. And MT5 does not reveal the server's time zone, so sessions, hours and weekdays depend on a setting in the script, which you set once after checking the server time in MT5.
How many trades before a number means something
The sample-size rule from earlier is a rule of thumb. If you want to know whether a result is more than luck, there is a simple test for it, and it uses numbers the journal already has.
Take your average result per trade, in R, and divide it by its standard error: the standard deviation of your results divided by the square root of the number of trades. That gives a t-statistic. The larger it is, the less likely it is that a strategy with no edge at all produced your results by chance, and the p-value puts a number on that: it is the probability of seeing results at least this good if there were no edge. In a setup I journalled earlier, 48 trades gave a t-statistic of 3.41 and a p-value of 0.0007: a 0.07% chance of seeing results like these from a strategy without an edge. The usual threshold for judging whether a result is real is a p-value below 0.05. That is a convention for a single test planned in advance, and it assumes your trades are independent and not extremely lopsided. Be stricter for anything you find by scanning many slices of the data.
Two warnings come with it. First, the shape of your results matters, not just their average. David Bailey and Marcos López de Prado showed that a Sharpe ratio needs a longer track record before it can be trusted when returns are negatively skewed (rare but large losses) or fat-tailed, and they turned that into a minimum track record length: the number of observations you need before a Sharpe ratio is reliably above a threshold you choose. Second, every extra breakdown is another test. Check 20 slices of your journal at the 5% level and you should expect one of them to look significant by pure chance. A result found by scanning many slices needs a fresh set of trades to confirm it.
Luckily, none of this needs to be calculated by hand. My journal shows the t-statistic, the one-sided p-value and the minimum track record length as three tiles, each with the number of trades behind it, computed in code and tested against hand-worked examples. The minimum track record length is counted in trades rather than days, because the many days without a trade would distort the shape of the returns.
What I tried and left out
I'm very happy with what AI managed to create for me. However, there was one metric that I wasn't able to build the way I wanted: maximum adverse excursion and maximum favourable excursion, usually shortened to MAE and MFE. They measure how far each trade moved against you and in your favour while it was open. They can be among the most useful numbers a journal tracks, because they show whether your stops may be too wide and whether winners turn into losers before you close them. For example, if the average MAE on your winners is only 0.35R across enough trades, that suggests your stops are wider than they need to be. Tightening them while keeping the risk per trade constant allows a larger position size, which can raise the average reward per trade. It can also stop out trades that would have recovered, and it raises your costs, so whether it improves your expectancy is something you test on your own data.
Sadly, MT5's trade history records neither, so the only way to get them is to read the price bars for the minutes each trade was open. I gave the agent one more read-only function for that, added it to the list of allowed calls and built the section: three tiles and a chart of how far each trade went against me, against how it finished.
It did not work. MT5 only serves the bar history that its "Max. bars in chart" setting allows, and for older trades the terminal returned a single nearby bar instead of the minutes I needed. A trade only counts when bars exist for both its first and last minute, and that was true for 40 of my 112 trades. Of the others, 70 have a stop but predate the history the terminal had on hand, and two had no stop at all. Even for the 40, the figures were approximations: the bars are bid prices, the spread had to be added for shorts, and the first and last minute include prices from just before the entry or just after the exit.
Conclusions from this data would not be reliable. The problem is not that the sample is incomplete, because every journal is a sample. The problem is that the trades outside the window are not a random selection: they are my oldest trades, and 40 of 112 is only about a third. The journal would have shown an answer that looks precise and describes only my most recent trading. How far back MT5 goes depends on the broker and on terminal settings, so I expect many traders to hit the same limit. I took the section out, removed the extra function again so the agent is back to reading trade history only, and left MAE and MFE out of this article and its interactive edition. If you want to track them, do it as you open and close trades, or with a platform that stores the price path of each trade.
What this does not do
It only works on Windows, with the desktop terminal, because the MT5 Python package does. My setup is also not built for an automatic refresh on Mac or Linux. If you use a Mac, you can paste the standard prompt from the interactive edition of this article into Claude Code and ask whether it can build the same thing for you on Mac (or Linux). I have not tested this.
Another key point to remember: building a dashboard like this is fun and feels like real progress. It is only real progress when you regularly come back to the data and analyse it. Otherwise you are tracking data for the sake of tracking data.
A first step this week
Open the interactive edition and play around with it, so the abstract topics in this article become concrete. Then choose your language, refresh schedule and time zone, and copy the prompt it writes for you. Paste it into Claude Code in an empty folder, with MT5 open and logged in. When the dashboard is ready, check one metric by hand on five trades before you trust the rest.
This article is for information and education only and is not investment advice. Past results, including those shown in any journal, are not an indication of future results.
This article is information and commentary. It is not investment advice, not a personal recommendation and not investment research, it takes no account of your circumstances, and it must not be relied on as a reason to trade. Any figure shown is historical or simulated and is not an indication of future results.
Get the next piece the day it is published.
One email when a new report lands, nothing else.
Exact figures, sources, steps and terms behind this piece, written for the coding agent you point at it.
Quote freely with attribution: name the author, Hello Purple and the canonical URL, with the publication date, all of which are in the Markdown twin’s front matter. The twin is the reference text of the piece.
Read the appendix
Facts and figures
- Lo (2002): annualising a Sharpe ratio with the square-root rule is valid only under special conditions; serial correlation overstated annual Sharpe ratios of hedge funds by as much as 65% in his example.
- Rough sample-size guide used in the piece: 30 trades minimum, 50 preferable, 100 or more before the data starts to become reliable; it applies to every subgroup (per weekday, per instrument) separately.
- A 20% drawdown requires a 25% gain to recover.
- MAE and MFE test: one extra read-only function (minute bars) was added and then removed. Complete minute bars existed for 40 of 112 trades, because MT5 serves only the history allowed by its "Max. bars in chart" setting; 70 other trades with a stop predate that history and two had no stop. The feature was dropped from the final journal.
- Significance test used in the piece: t = average result per trade / (standard deviation / square root of number of trades); a p-value below 0.05 is the usual threshold for a single, pre-planned test. Example from an earlier journal: 48 trades, t = 3.41, p = 0.0007.
- Bailey and López de Prado (2012): the minimum track record length grows with negative skewness and positive excess kurtosis.
- The MetaTrader 5 Python package runs on Windows only and talks to the desktop terminal, not the web version.
- Build in the piece: about 15 minutes for the core journal, about an hour including extensions; Claude Opus 5.5; 168,000 output tokens and about $10 at API prices after the first hour.
- Minimum track record length in the journal is computed on per-trade returns, so it is expressed in trades.
Steps to reproduce
- Open the MT5 desktop terminal and log in to the account whose history you want.
- Create an empty folder and start Claude Code inside it.
- Give one prompt covering: read-only data access (no order functions, no stored password, a test that fails if order functions appear); anonymisation on import (drop account, server and broker identifiers; convert amounts to percentages of starting equity; exclude deposits and withdrawals); a single offline HTML dashboard with a Performance tab and a Journal tab; every metric computed in code with its formula shown; a scheduled refresh that keeps the last version on failure and logs errors.
- Approve each installation and the scheduled task explicitly.
- Verify at least one metric by hand on five trades.
Limits
Windows and the MT5 desktop terminal only for automatic refresh; the Mac and Linux route is untested. MAE and MFE could not be built reliably: the price history needed is not always available. The equity curve uses closed trades. R-multiples require a stop loss set with the entry order. Server time zone is a manual setting. Sharpe, Sortino and Calmar are indicative on histories shorter than one year.
Sources and links
- Lo, The Statistics of Sharpe Ratios (Financial Analysts Journal, 2002): https://rpc.cfainstitute.org/research/financial-analysts-journal/2002/the-statistics-of-sharpe-ratios
- Bailey and López de Prado, The Sharpe Ratio Efficient Frontier (Journal of Risk, 2012): https://ideas.repec.org/a/rsk/journ4/2223785.html
- pdmt5 documentation (a wrapper around the MetaTrader5 package), stating that the MetaTrader5 API requires Windows: https://pypi.org/project/pdmt5/
Terms
- Equity curve: account value over time, here indexed to 100 at the start.
- Drawdown: the fall from the previous highest point, in percent.
- Expected value (EV): the average result per trade, in percent of equity.
- Realised risk-reward: average winning trade divided by average losing trade.
- R-multiple: a trade's result divided by the risk it started with, the distance to its stop loss.
- Sharpe ratio: average return divided by the volatility of returns, asking whether the returns justify the bumpiness of the ride.
- Sortino ratio: like the Sharpe ratio, but only downside volatility counts.
- Calmar ratio: annualised return divided by maximum drawdown.
- t-statistic: average result per trade divided by its standard error.
- p-value: the probability of seeing results at least this good if there were no edge.
- Minimum track record length: the number of observations needed before a Sharpe ratio is reliably above a chosen threshold.
- MAE and MFE: maximum adverse and maximum favourable excursion, how far a trade moved against you and in your favour while it was open. Not available from MT5's trade history alone.
About this piece
Built and written by Yorben De Reuse on his own MT5 account. Purple, which publishes Hello Purple, builds technology that connects AI agents to trading accounts.
Financial Market Analyst at Purple Technology. Holds a bachelor's degree in Finance and Insurance from HOGent, graduated with honours, and previously worked as an investment analyst at a family office. Spent two years in an investment club, analysing stocks and preparing pitches for the other members. Has traded his own account for five years across risk-premia harvesting, order flow trading and discretionary momentum swing setups, and built his own strategies on well-known concepts like open drives, inside days and open gaps. Writes here about AI in finance in practice, with a focus on trading and investing.